Fig. 4
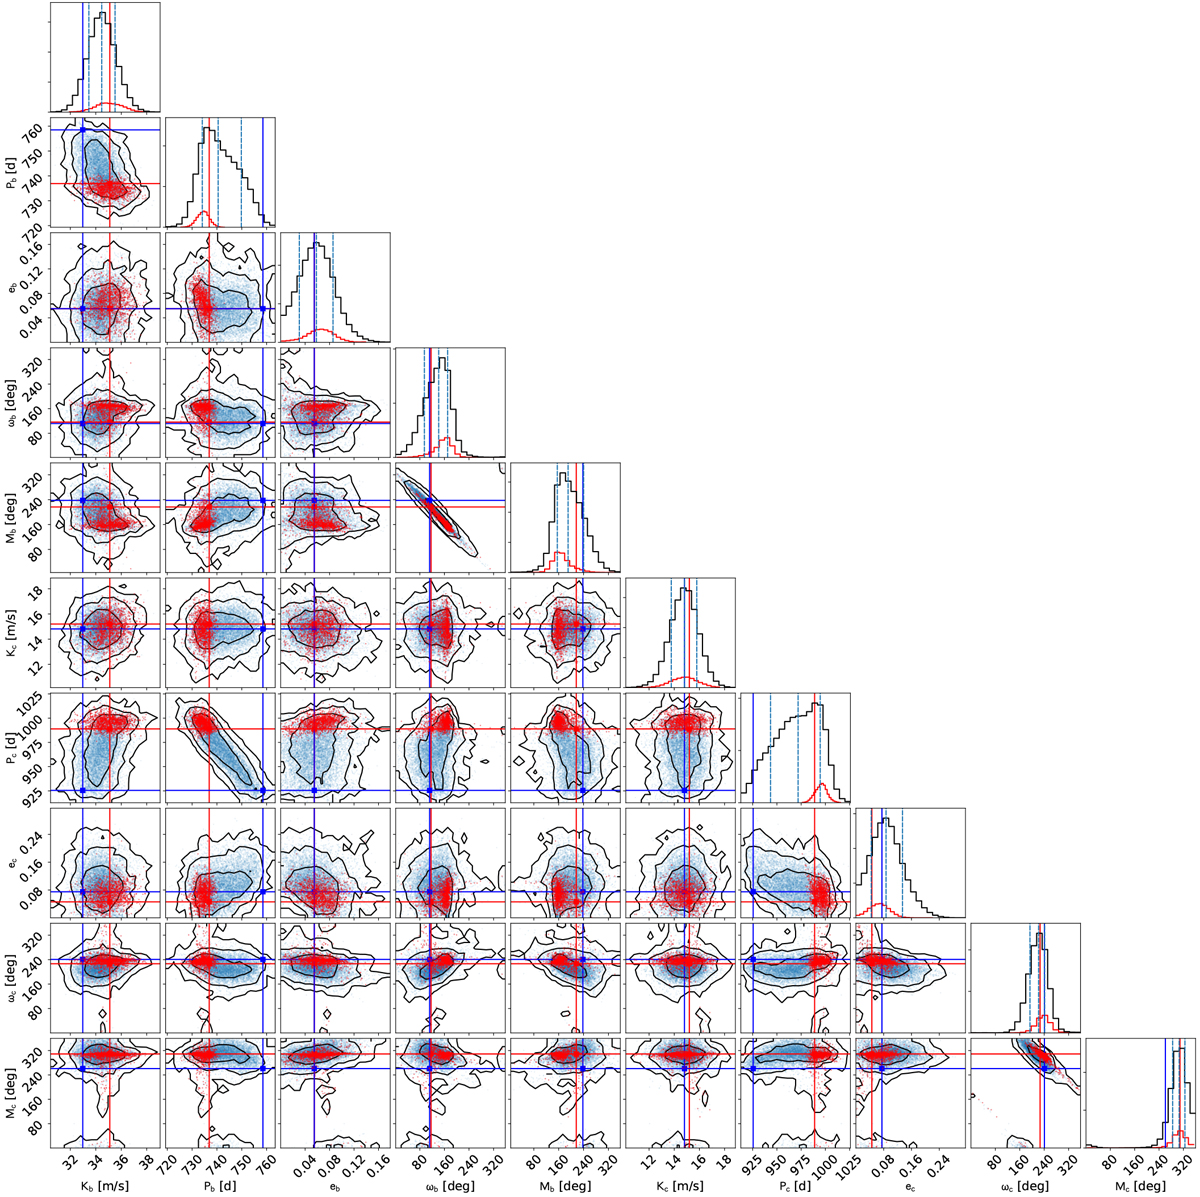
Posterior distributions of the orbital parameters of the 7 CMa system. Each panel contains ~ 100 000 samples, which are tested for 1 Myr dynamical stability using the MVS integrator. Stable solutions are overplotted in red. The top panels of the corner plot show the probability density distributions of each orbital parameter of the overall MCMC samples (black) and the stable samples (red). The vertical dashed lines indicate the 16th, 50th, and the 84th percentiles of the overall MCMC samples. Contours are drawn to improve the visualization of the 2D histograms and indicate the 68.3, 95.5, and 99.7% confidence interval levels (i.e., 1σ, 2σ, and 3σ). Blue and red crosses indicate the dynamical best-fit solution (central column of Table 2) and the stable best-fit solution (last column of Table 2), respectively.
Current usage metrics show cumulative count of Article Views (full-text article views including HTML views, PDF and ePub downloads, according to the available data) and Abstracts Views on Vision4Press platform.
Data correspond to usage on the plateform after 2015. The current usage metrics is available 48-96 hours after online publication and is updated daily on week days.
Initial download of the metrics may take a while.