Fig. 3
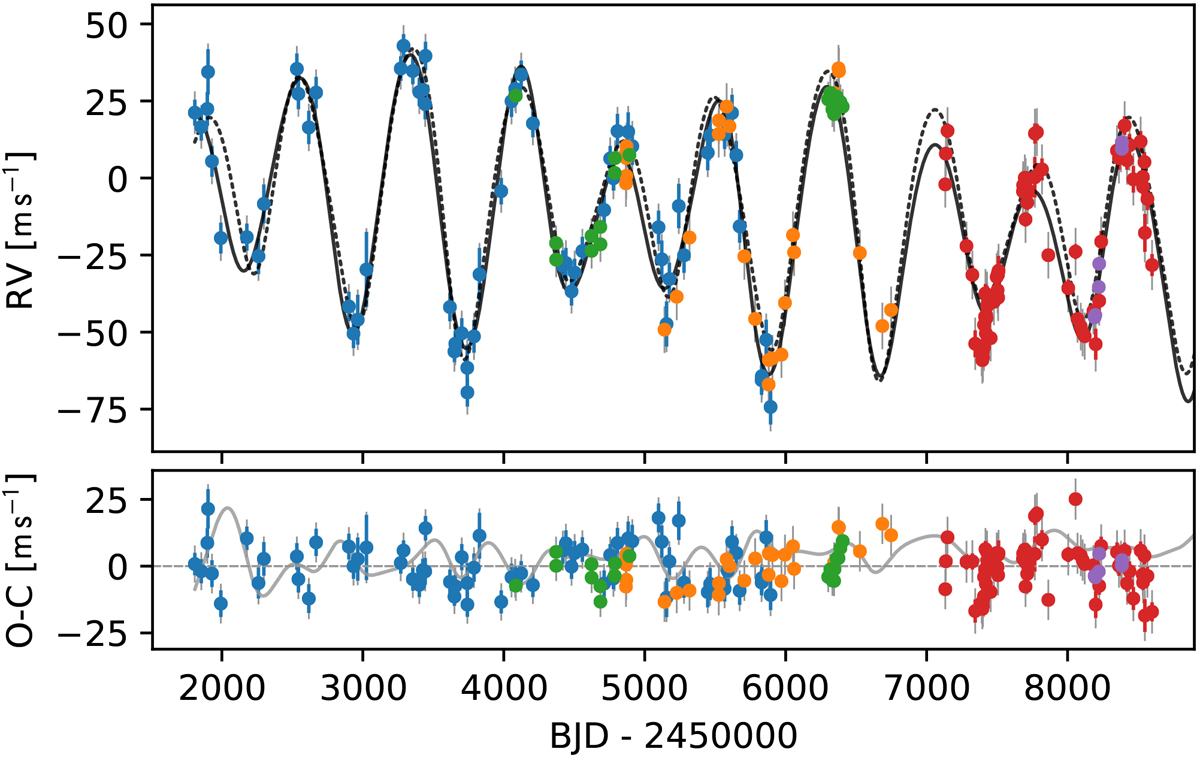
Time series of the 182 RVs obtained for 7 CMa from September 2000 to April 2019 with Lick (blue), UCLES (orange), HARPS (before/after the fiber upgrade of 2015 in green/purple, respectively), and SONG (red) facilities. The vertical gray lines indicate the error bars including jitter. The best double Keplerian fit to the data is drawn with a dotted line, while the solid black line indicates the best dynamical two-planet fit. The residuals of the dynamical fit and the difference between the Keplerian and dynamical models (solid gray line) are shown in the bottom panel.
Current usage metrics show cumulative count of Article Views (full-text article views including HTML views, PDF and ePub downloads, according to the available data) and Abstracts Views on Vision4Press platform.
Data correspond to usage on the plateform after 2015. The current usage metrics is available 48-96 hours after online publication and is updated daily on week days.
Initial download of the metrics may take a while.