Fig. 2
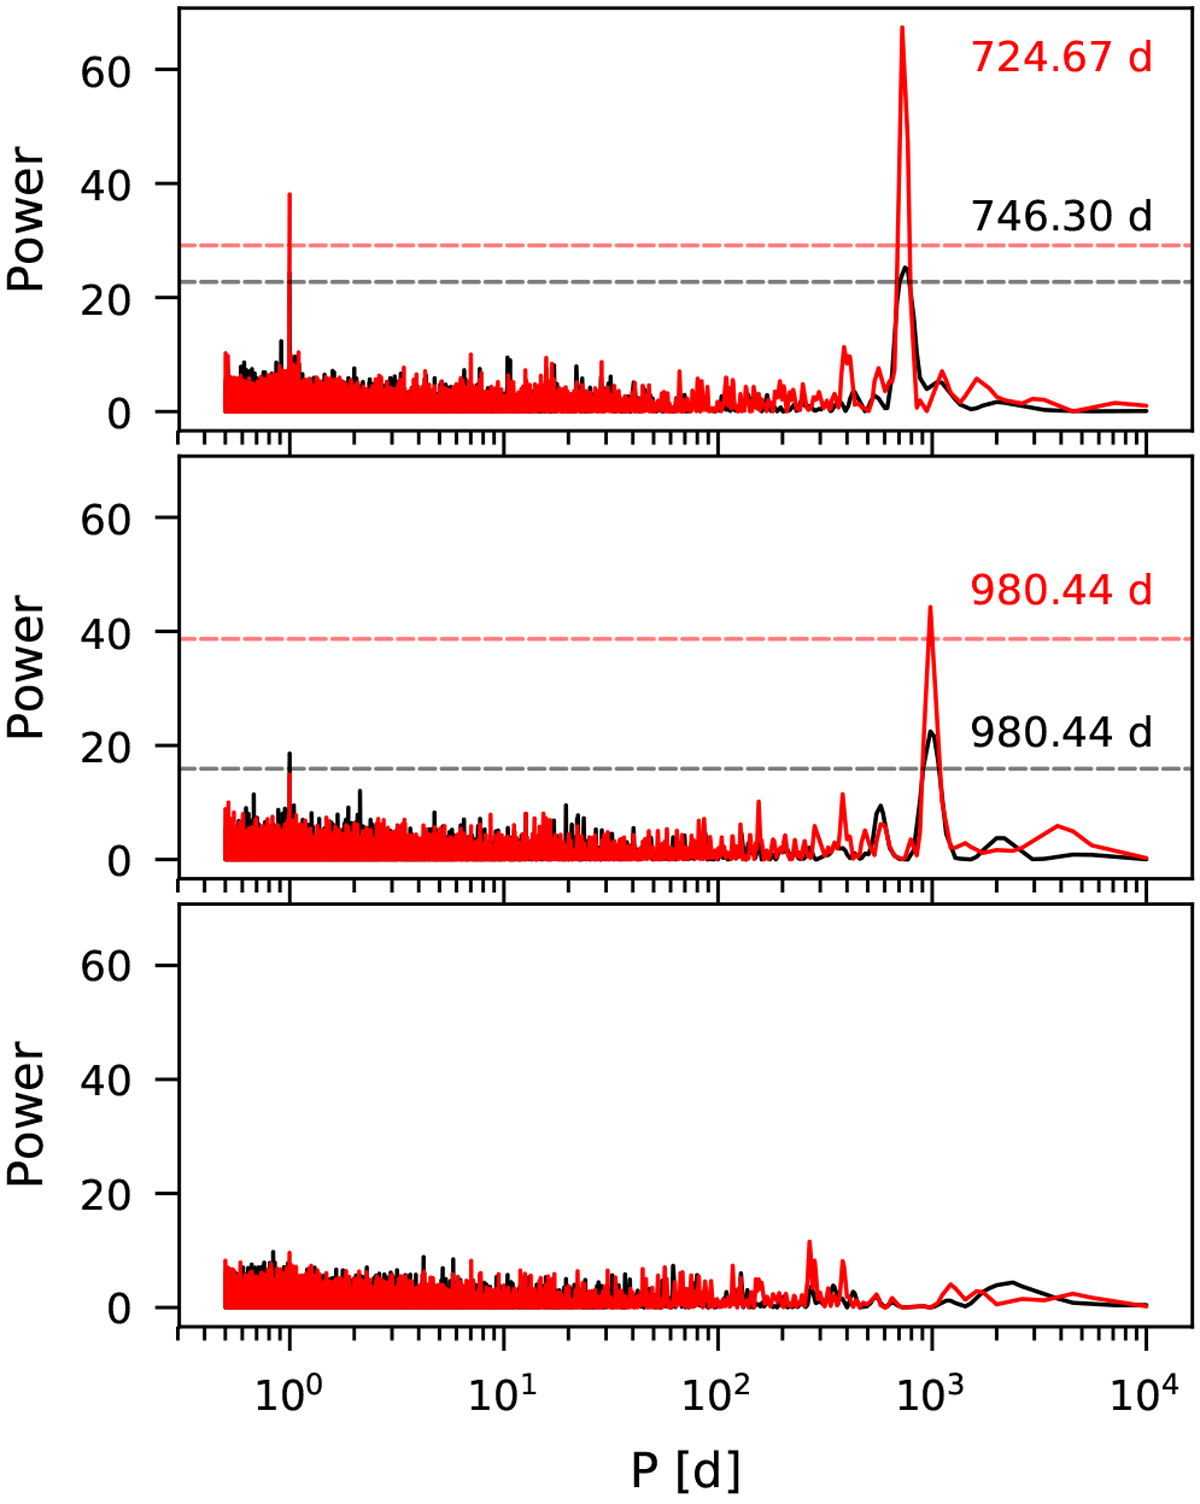
Top panel: Lomb-Scargle (LS) periodogram of the RVs. The periodogram of the Lick data only is shown in black, while the LS periodogram of the complete RV dataset is shown in red. A RV offset and a jitter term are individually fitted for each dataset in addition to a global linear trend. The highest peak at ~ 735 ± 10 d is consistentwith the planet claimed by Wittenmyer et al. (2011). Center panel: LS periodogram of the residuals to the Keplerian orbit fit of the ~735 d signal. The highest peak at 980 d hints at the presence of a second planet in the system. Bottom panel: LS periodogram of the residuals to the Keplerian orbital fit of the two main signals. The horizontal lines in the panels show a false alarm probability level of 0.1% in black and red for Lick and complete dataset, respectively. The period of the highest peak in the LS periodogram is indicated with the color corresponding to each of the datasets.
Current usage metrics show cumulative count of Article Views (full-text article views including HTML views, PDF and ePub downloads, according to the available data) and Abstracts Views on Vision4Press platform.
Data correspond to usage on the plateform after 2015. The current usage metrics is available 48-96 hours after online publication and is updated daily on week days.
Initial download of the metrics may take a while.