Fig. 15.
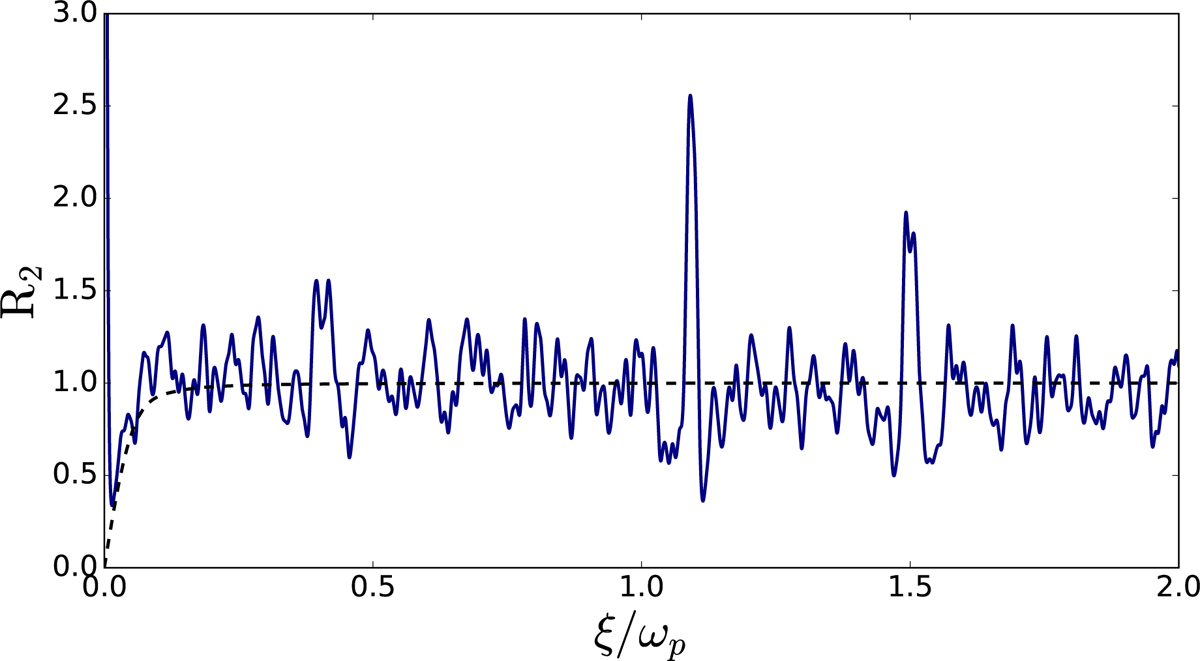
Comparison of the “stellar” autocorrelation R2(ξ) at Ω/Ωk = 0.589, represented in solid line, with the GOE autocorrelation represented by a dashed line. To compare the “stellar” and GOE autocorrelations, two changes have been made. First, the autocorrelation of our model has been re-scaled so that the value of the plateau, i.e. the line around which there are fluctuations, is approximately unity. The value of the plateau otherwise depends on the mean density ![]() and the Gaussian smoothing of the spectrum. Secondly, the GOE distribution has been rescaled, in the direction of the x axis, by the mean level spacing of the Ω/Ωk = 0.589 spectrum in the frequency domain considered.
and the Gaussian smoothing of the spectrum. Secondly, the GOE distribution has been rescaled, in the direction of the x axis, by the mean level spacing of the Ω/Ωk = 0.589 spectrum in the frequency domain considered.
Current usage metrics show cumulative count of Article Views (full-text article views including HTML views, PDF and ePub downloads, according to the available data) and Abstracts Views on Vision4Press platform.
Data correspond to usage on the plateform after 2015. The current usage metrics is available 48-96 hours after online publication and is updated daily on week days.
Initial download of the metrics may take a while.