Fig. 4.
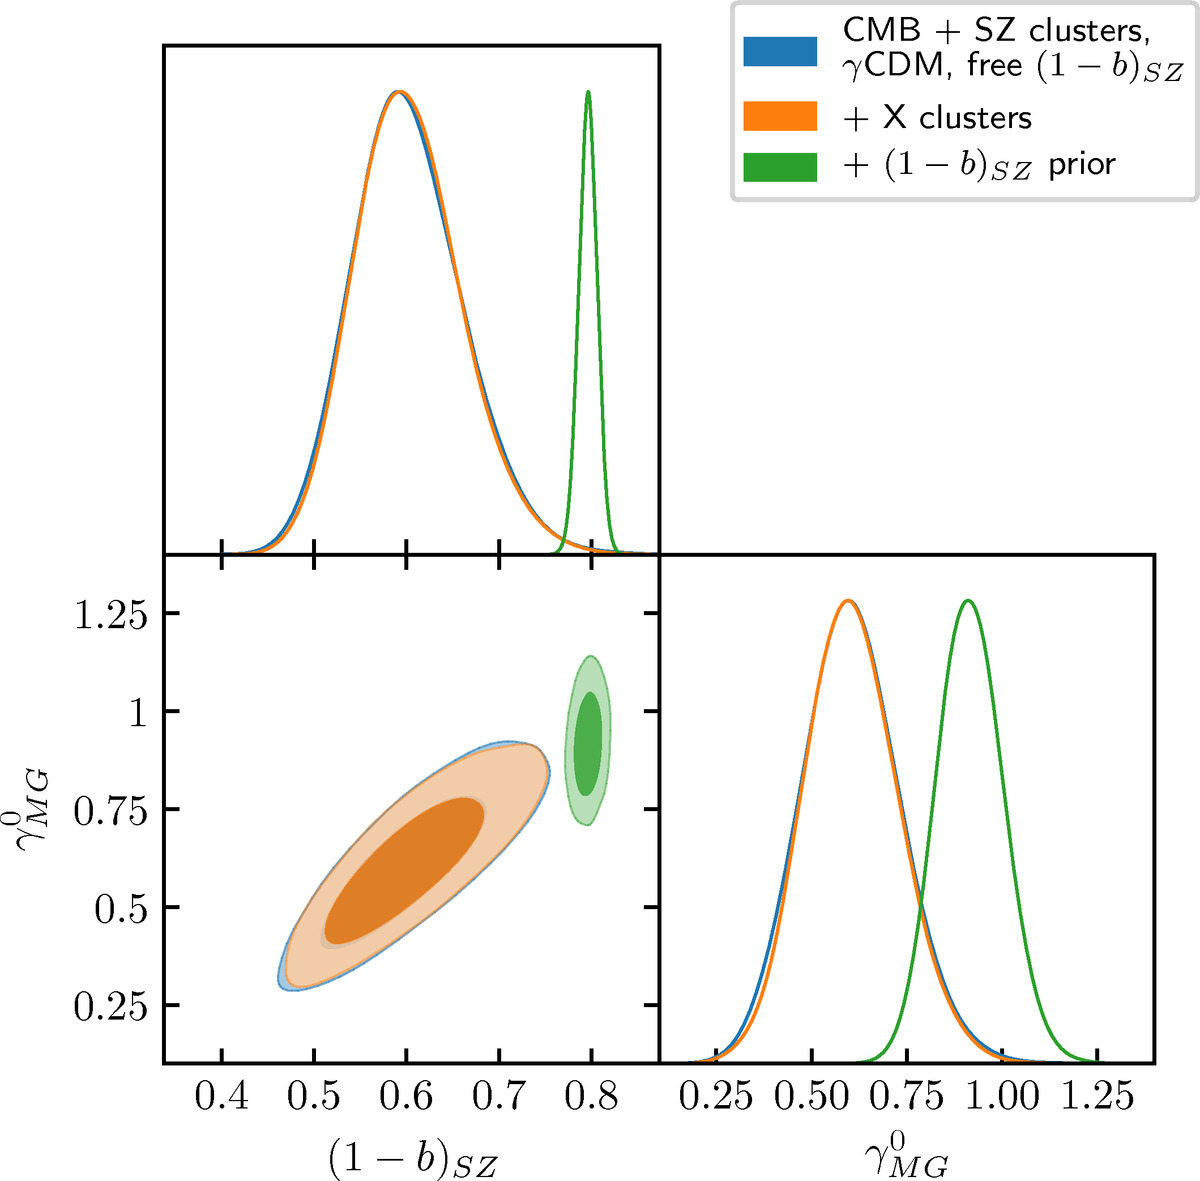
Confidence contours (68 and 95%) and posterior distributions for growth index γ and mass calibration parameter (1 − b) when combining CMB and SZ cluster data for D16 mass function (blue). The effect of adding X-ray clusters data is shown in orange, and the effect of a strong prior on (1 − b) centred around the Planck calibration value of 0.8 in green.
Current usage metrics show cumulative count of Article Views (full-text article views including HTML views, PDF and ePub downloads, according to the available data) and Abstracts Views on Vision4Press platform.
Data correspond to usage on the plateform after 2015. The current usage metrics is available 48-96 hours after online publication and is updated daily on week days.
Initial download of the metrics may take a while.