Free Access
Fig. 3.
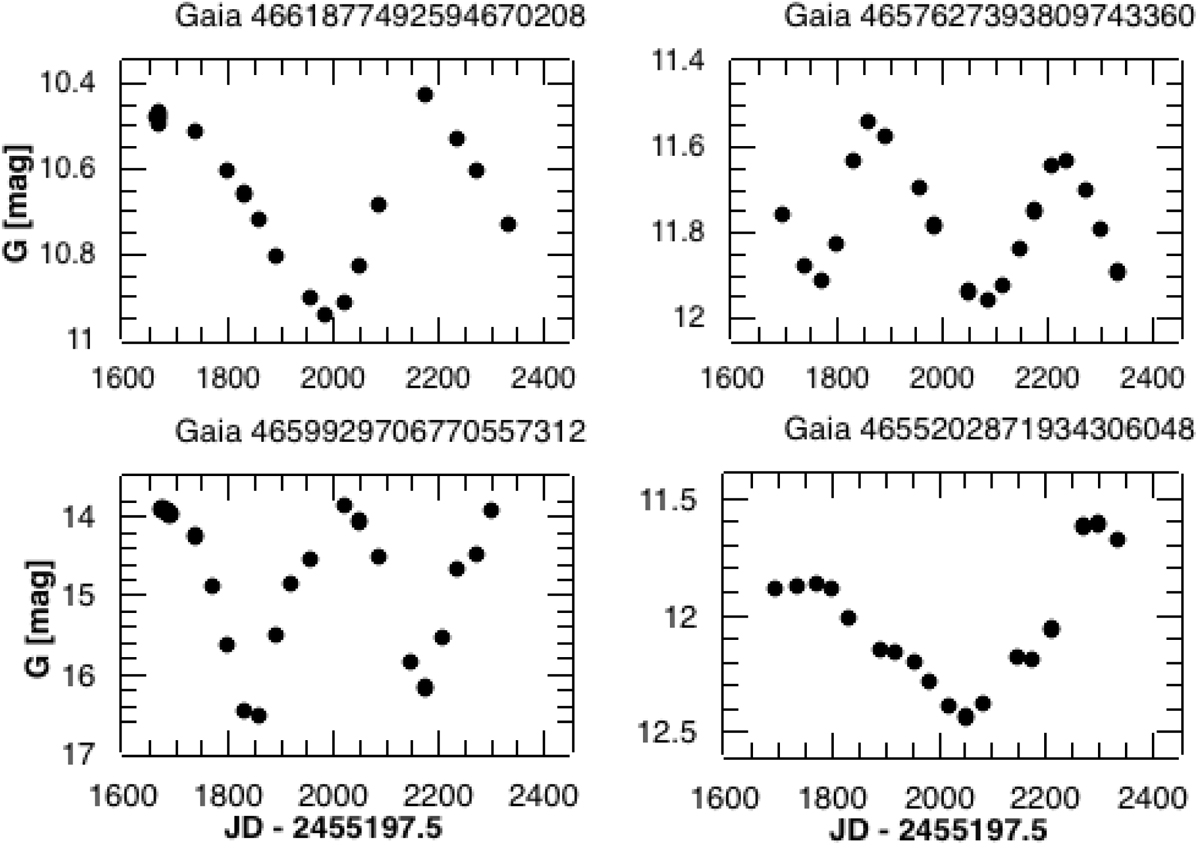
Example Gaia light curves of four group [d] stars. Top row: two representative supergiants. Bottom left: large amplitude variable, likely a massive AGB star. Bottom right: incomplete light curve coverage to determine a period reliably.
Current usage metrics show cumulative count of Article Views (full-text article views including HTML views, PDF and ePub downloads, according to the available data) and Abstracts Views on Vision4Press platform.
Data correspond to usage on the plateform after 2015. The current usage metrics is available 48-96 hours after online publication and is updated daily on week days.
Initial download of the metrics may take a while.