Fig. 18.
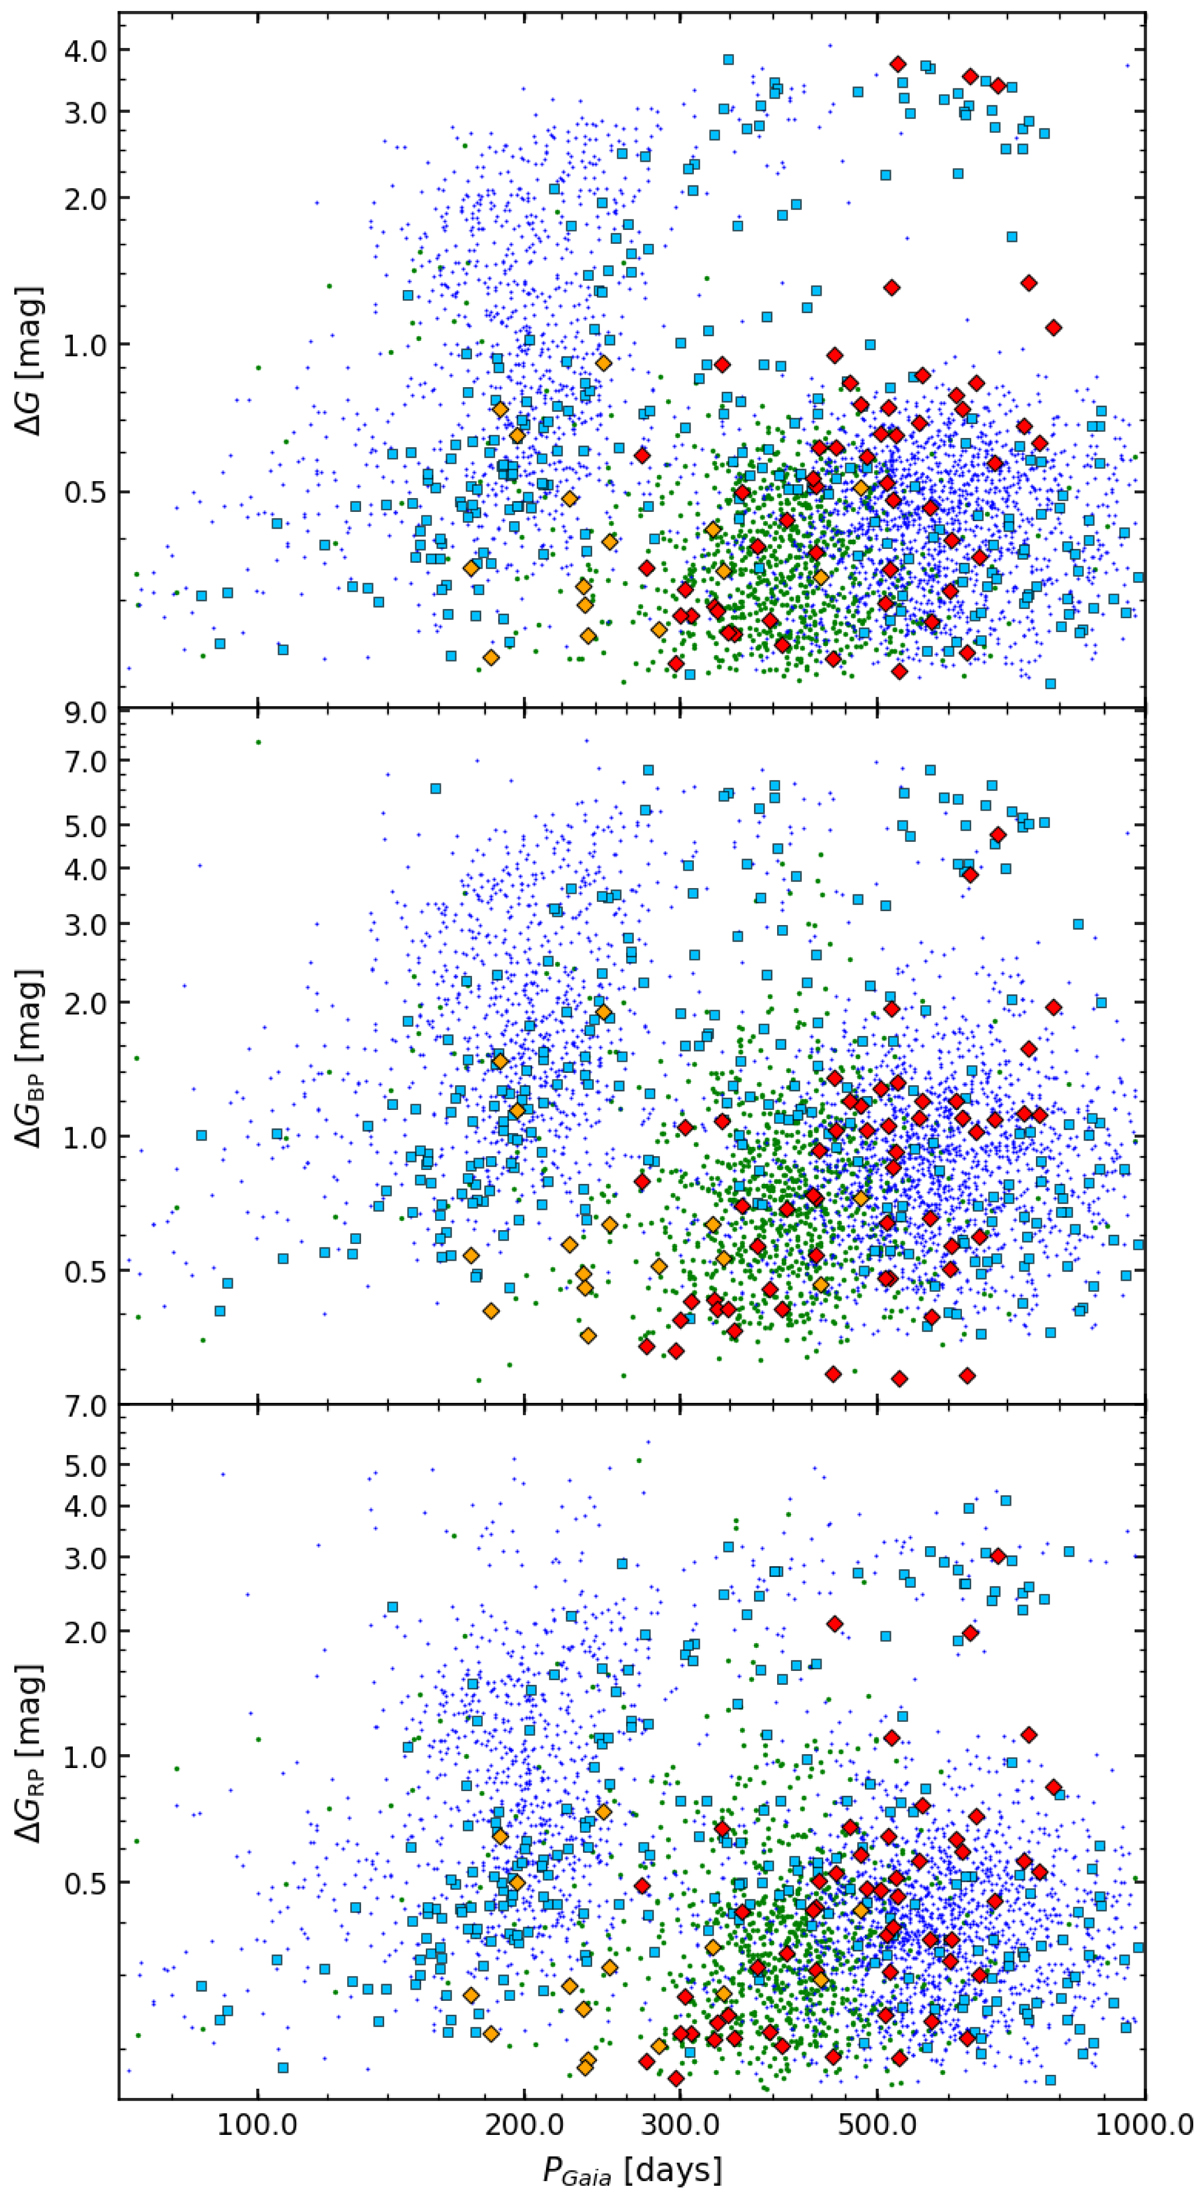
Period-amplitude diagrams of O-rich stars, colour coded by evolutionary group to which they belong. The green dots indicate faint AGBs and RGBs, the blue dots indicate low-mass AGBs, and the cyan squares indicate intermediate-mass AGBs. The massive AGBs and RSGs from branch (d) are shown as orange/red diamond symbols according to whether they belong to sequence C′/C in the P–WBP, RP diagram. The three panels present the amplitudes in G, GBP, and GRP, respectively, taken from the magnitude ranges published in Gaia DR2.
Current usage metrics show cumulative count of Article Views (full-text article views including HTML views, PDF and ePub downloads, according to the available data) and Abstracts Views on Vision4Press platform.
Data correspond to usage on the plateform after 2015. The current usage metrics is available 48-96 hours after online publication and is updated daily on week days.
Initial download of the metrics may take a while.