Fig. 14.
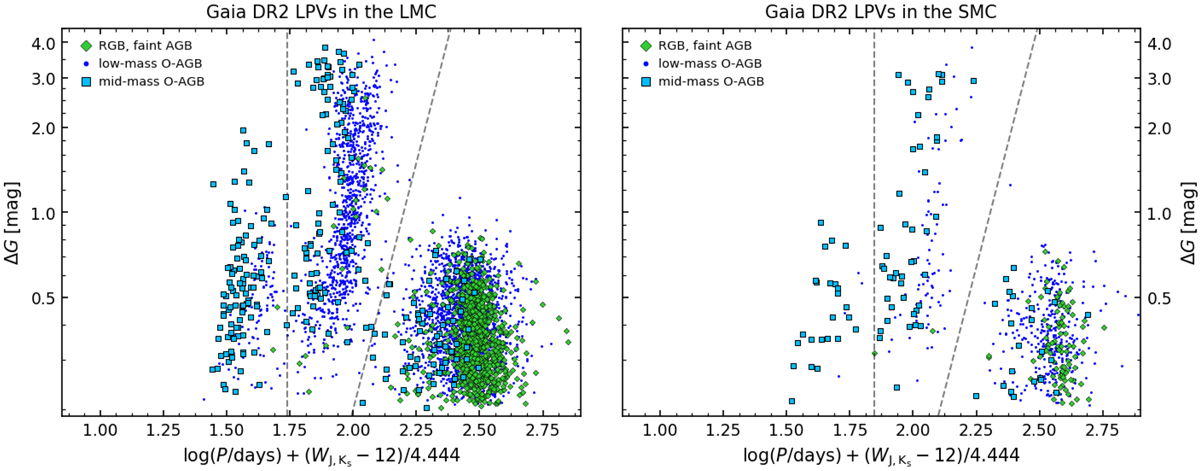
Projected-period vs. GaiaG-band amplitude (see text) of low- and intermediate-mass O-rich AGBs in the LMC (left) and SMC (right). The green diamonds indicate RGBs and faint AGBs; the blue symbols indicate low-mass O-rich AGBs; and the cyan squares indicate intermediate-mass O-rich AGBs. The dashed lines represent approximate separations between the three distributions corresponding to 1O mode periods, fundamental mode periods, and LSPs.
Current usage metrics show cumulative count of Article Views (full-text article views including HTML views, PDF and ePub downloads, according to the available data) and Abstracts Views on Vision4Press platform.
Data correspond to usage on the plateform after 2015. The current usage metrics is available 48-96 hours after online publication and is updated daily on week days.
Initial download of the metrics may take a while.