Fig. 8.
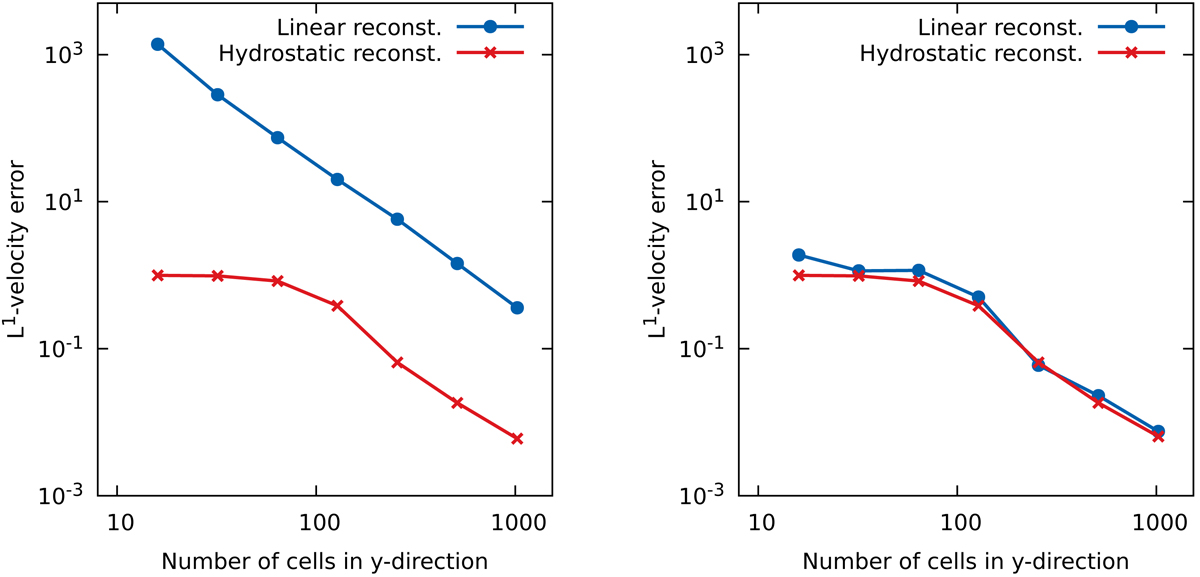
Convergence curves for the wave propagating solution in the corona for t = 200 s and a period T0 = 20 s. Left panel: low-amplitude wave (A0 = 1 cm s−1) and right panel: moderate-amplitude wave (A0 = 1000 cm s−1). The blue line with circles shows the L1-norm of the vertical velocity component error for the standard second order MUSCL-Hancock scheme (linear reconstruction), and the red line with crosses corresponds to the same scheme with local hydrostatic reconstruction.
Current usage metrics show cumulative count of Article Views (full-text article views including HTML views, PDF and ePub downloads, according to the available data) and Abstracts Views on Vision4Press platform.
Data correspond to usage on the plateform after 2015. The current usage metrics is available 48-96 hours after online publication and is updated daily on week days.
Initial download of the metrics may take a while.