Fig. 3.
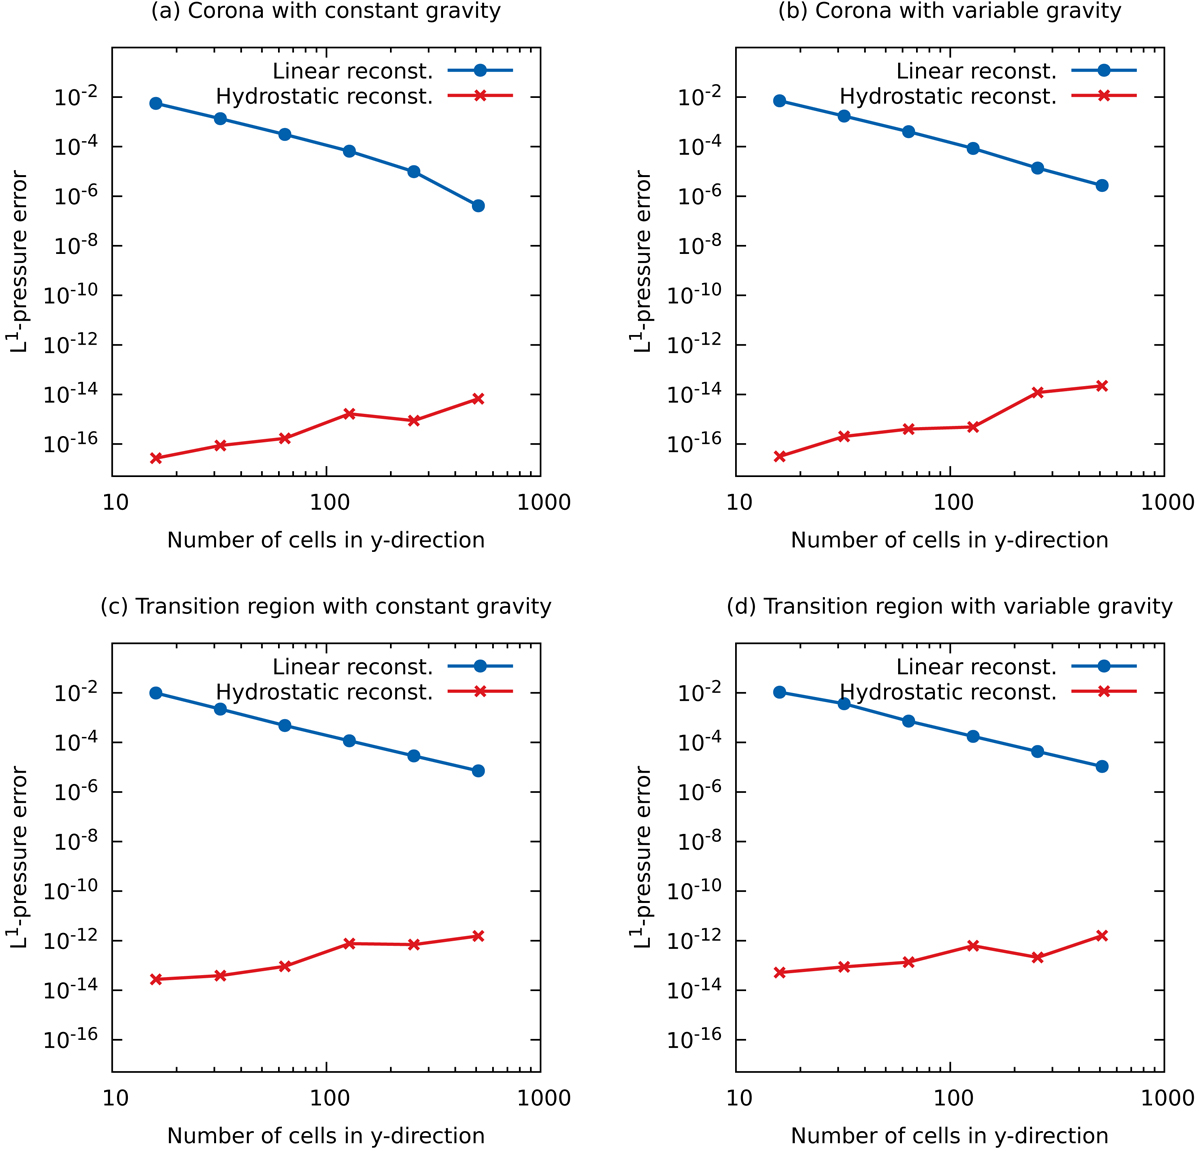
Convergence curves for isothermal and linearly variable temperature hydrostatic equilibrium conditions with constant and variable gravity for the atmospheric data of Table 1. The blue line with circles shows the L1-norm of the pressure error for the standard second order MUSCL-Hancock scheme (linear reconstruction), and the red line with crosses corresponds to the MUSCL-Hancock scheme with local hydrostatic reconstruction.
Current usage metrics show cumulative count of Article Views (full-text article views including HTML views, PDF and ePub downloads, according to the available data) and Abstracts Views on Vision4Press platform.
Data correspond to usage on the plateform after 2015. The current usage metrics is available 48-96 hours after online publication and is updated daily on week days.
Initial download of the metrics may take a while.