Free Access
Fig. 2.
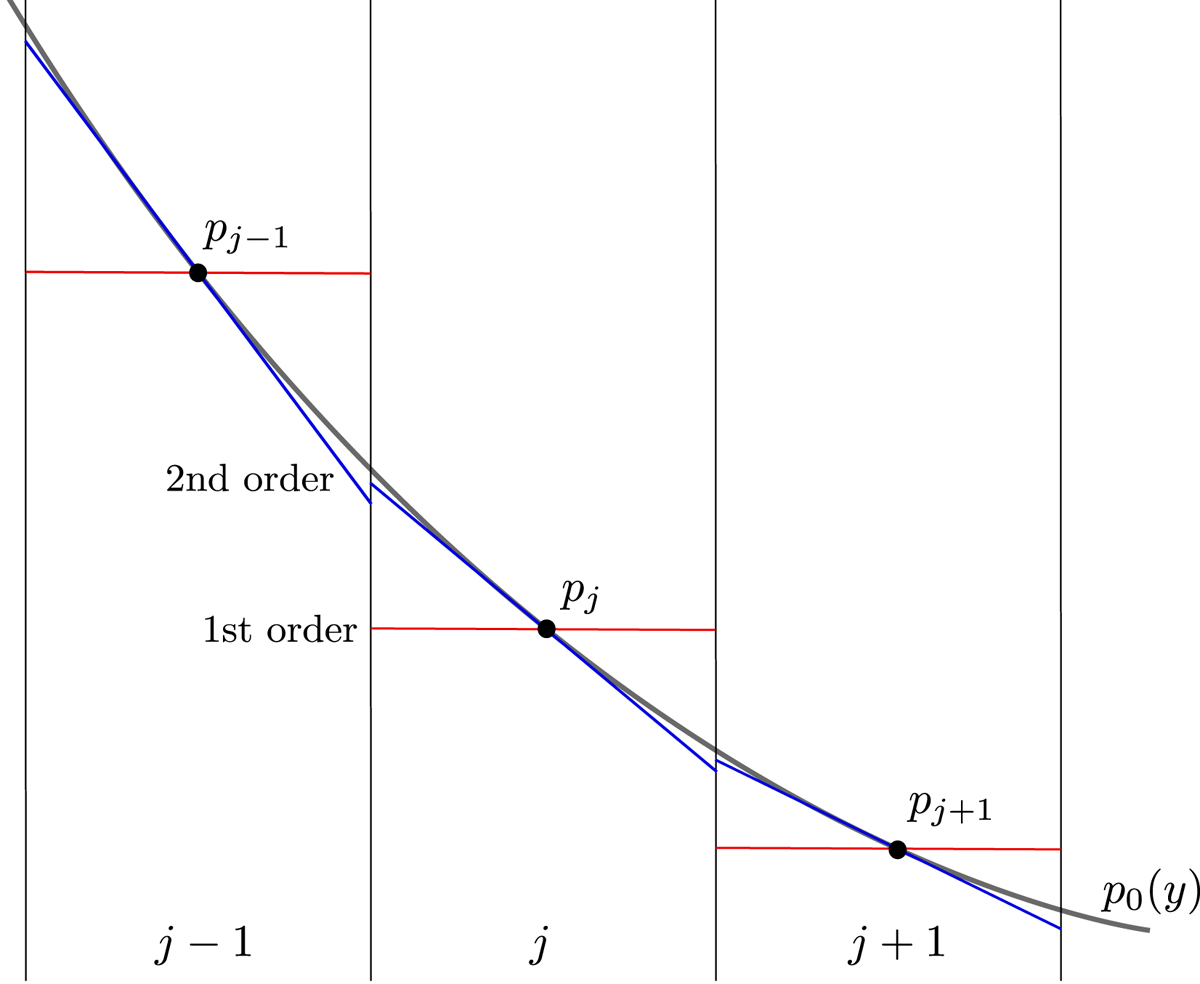
First (red lines) and second (blue lines) order standard reconstruction in a hydrostatic pressure distribution. The solid black line represents the equilibrium hydrostatic pressure p0(y).
Current usage metrics show cumulative count of Article Views (full-text article views including HTML views, PDF and ePub downloads, according to the available data) and Abstracts Views on Vision4Press platform.
Data correspond to usage on the plateform after 2015. The current usage metrics is available 48-96 hours after online publication and is updated daily on week days.
Initial download of the metrics may take a while.