Fig. 6.
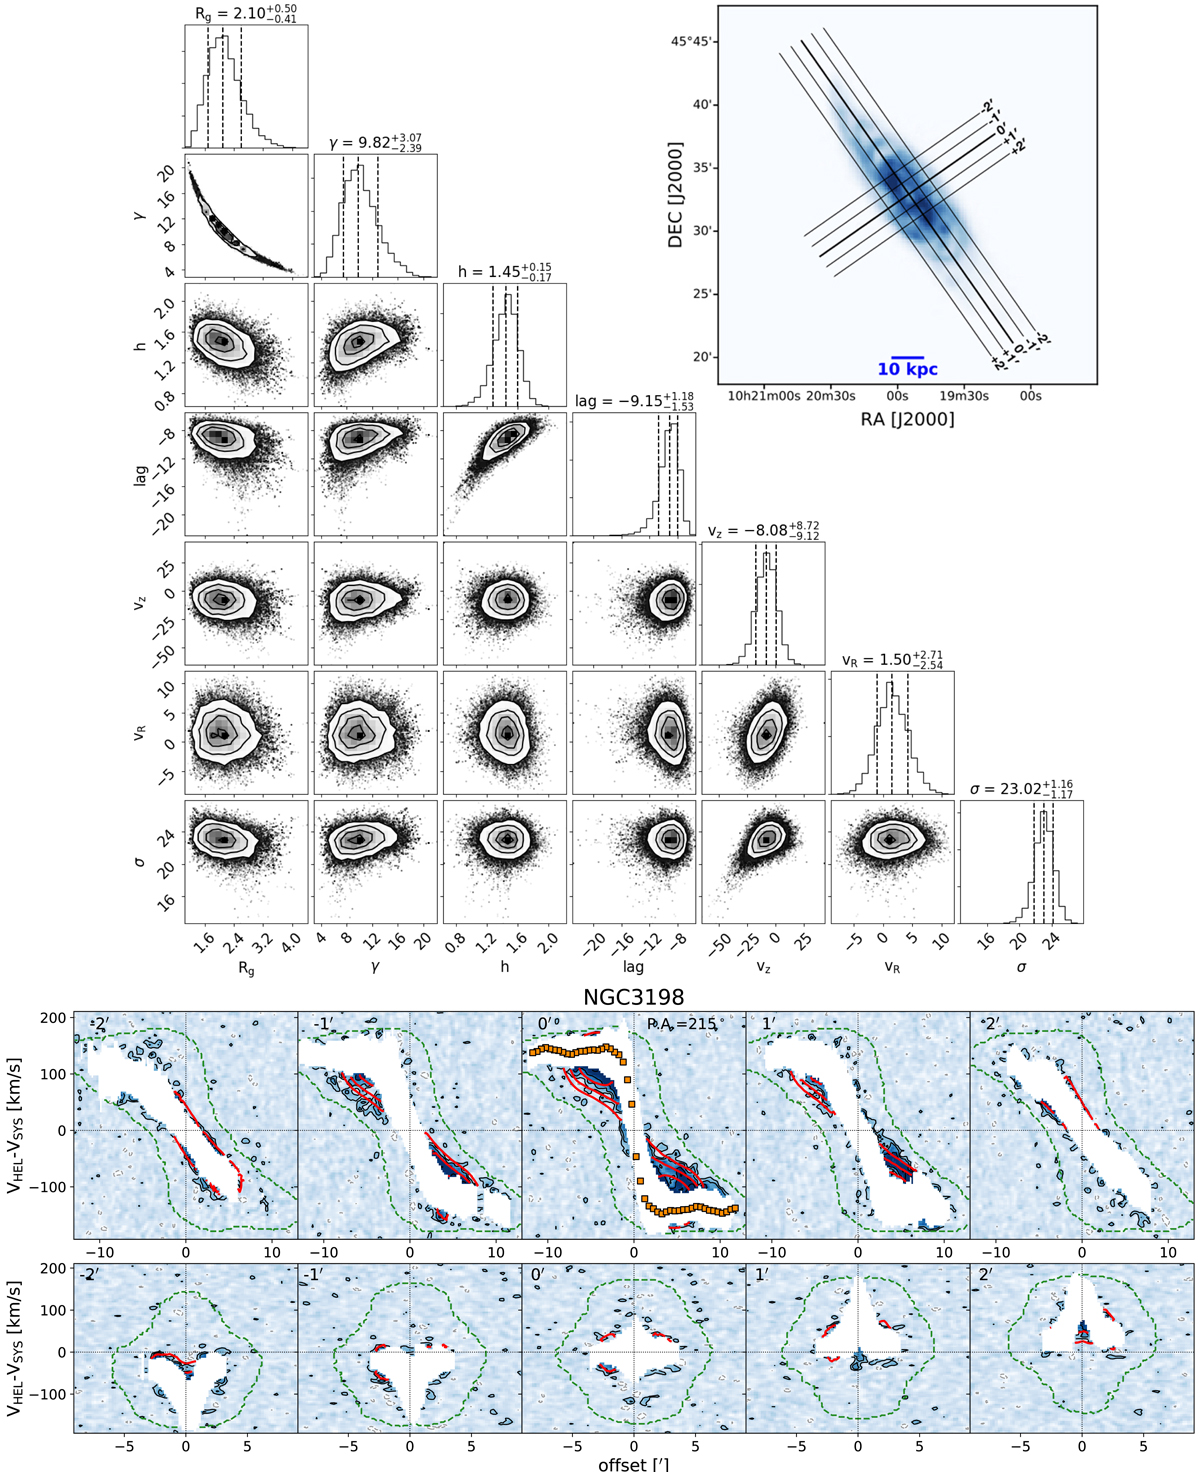
Top: corner-plots showing the correlation between the various parameters (shaded regions, with contours at arbitrary iso-density levels) along with their marginalised probability distribution (histograms on top) for the EPG of NGC 3198. Top-right inset: total H I map of NGC 3198 showing the cuts parallel to the major and minor axes used in pv-slices below. Bottom: pv-slices for the data (black contours) and for our best-fit model (red contours). Slice off-sets are indicated on the top-left of each panel. The white area and the green dashed contour indicate the internal and external mask, respectively. Orange squares show the rotation velocities determined with 3DBAROLO. Contours are spaced by powers of 2, the outermost being at an intensity level of 0.28 mJy beam−1 (2σnoise). A negative contour (−2σnoise) is shown for the data as a dashed grey line.
Current usage metrics show cumulative count of Article Views (full-text article views including HTML views, PDF and ePub downloads, according to the available data) and Abstracts Views on Vision4Press platform.
Data correspond to usage on the plateform after 2015. The current usage metrics is available 48-96 hours after online publication and is updated daily on week days.
Initial download of the metrics may take a while.