Fig. 5.
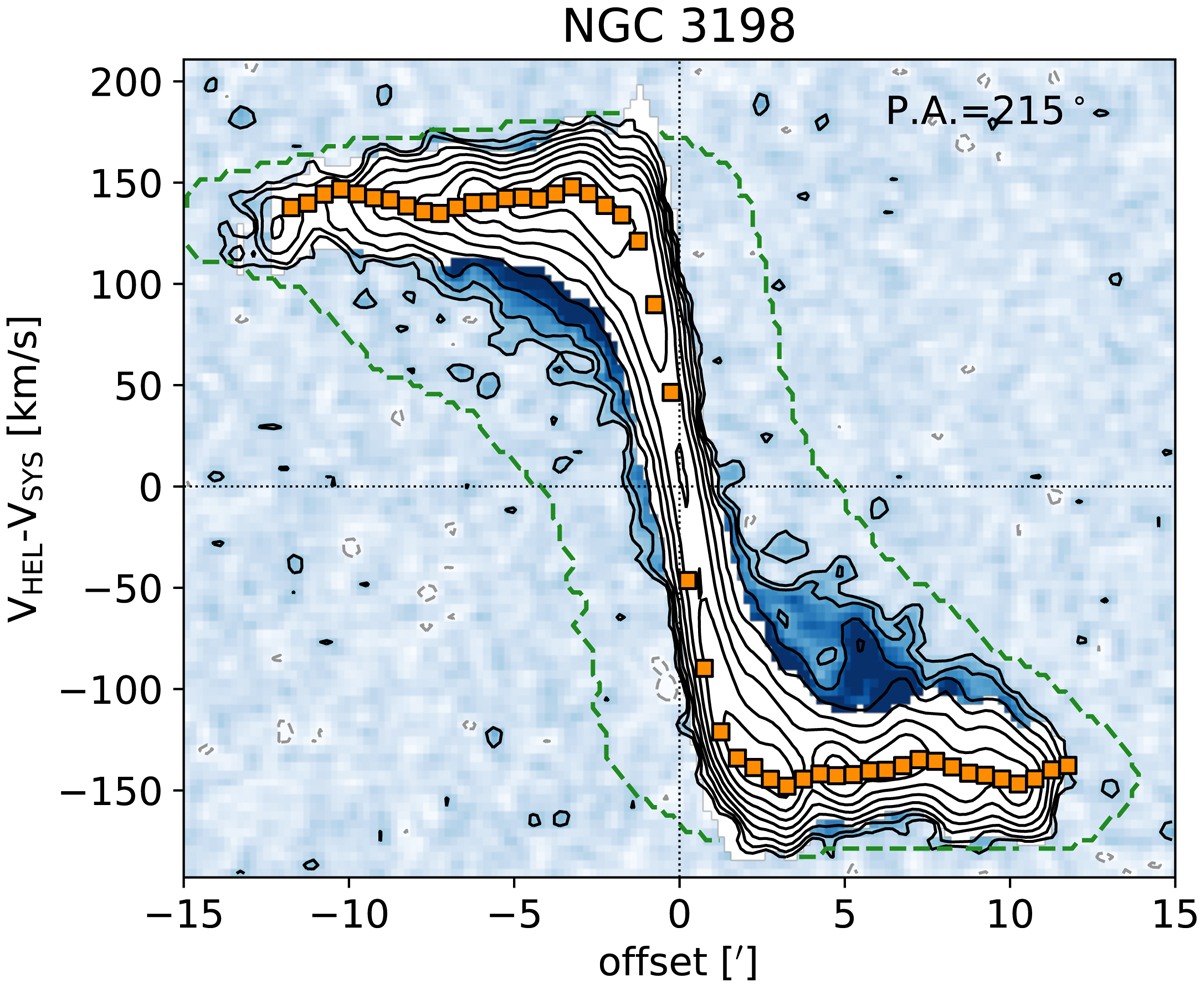
Position-velocity slice along the major axis of NGC 3198 (1′≃4.2 kpc at the distance adopted). The white area shows the emission from the thin H I disc (internal mask), derived as discussed in Sect. 2.2. The region outside the green dashed contour (external mask) is not associated to the galaxy and is set to zero in the data. The orange squares show the rotation curve derived with 3DBAROLO. Black contours are spaced by powers of 2, the outermost being at an intensity level of 0.28 mJy beam−1 (2σnoise). A negative contour (−2σnoise) is shown as a dashed grey contour.
Current usage metrics show cumulative count of Article Views (full-text article views including HTML views, PDF and ePub downloads, according to the available data) and Abstracts Views on Vision4Press platform.
Data correspond to usage on the plateform after 2015. The current usage metrics is available 48-96 hours after online publication and is updated daily on week days.
Initial download of the metrics may take a while.