Fig. C.1.
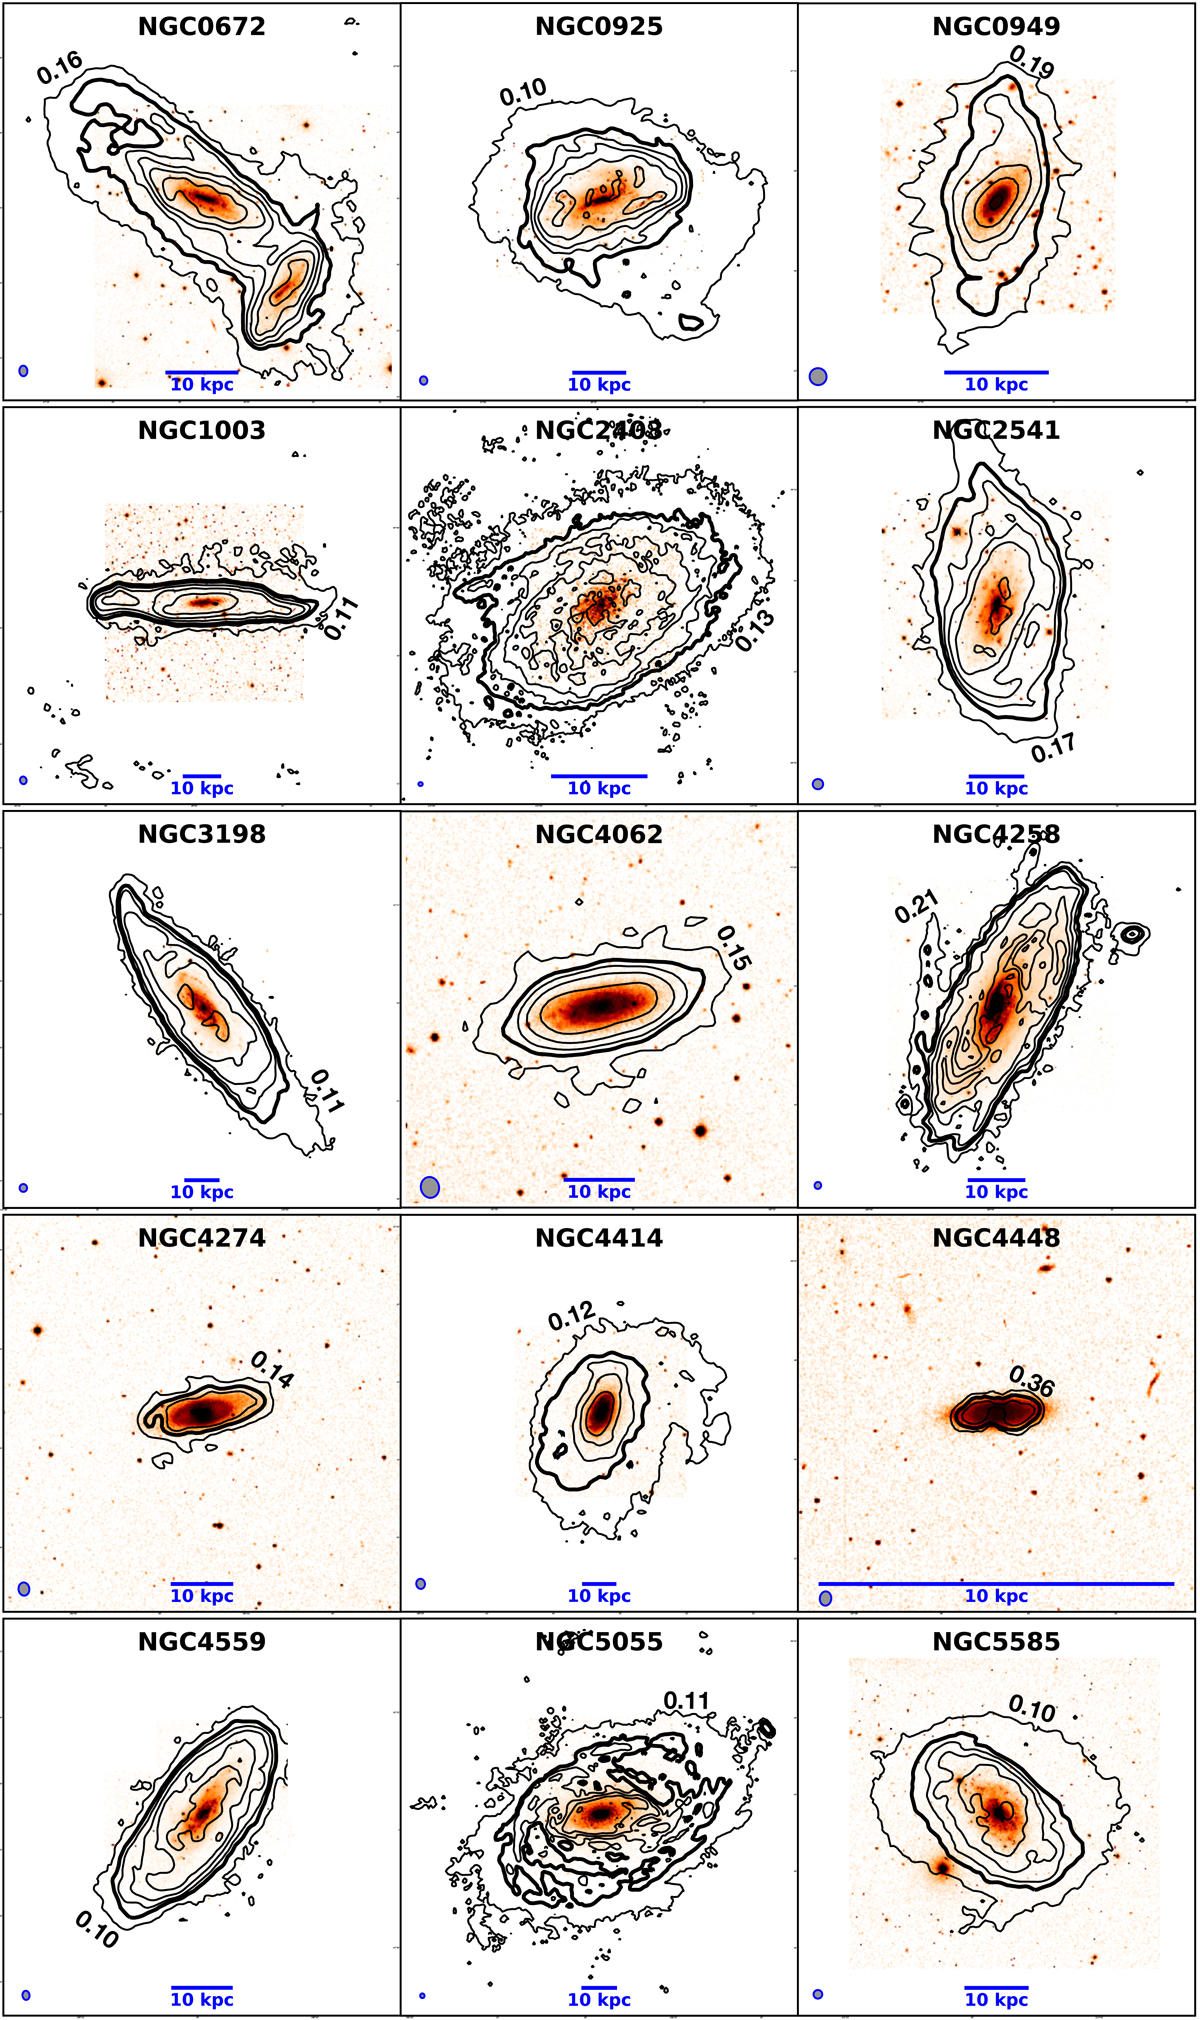
H I column density maps for the 15 HALOGAS galaxies in our sample (black contours) overlaid on top of their optical images. The outermost contour is set to a signal-to-noise ratio (S/N) of 3, its value varies and is indicated on each panel in units of M⊙ pc−2. The remaining contours are spaced by powers of 2, the first (thicker line) being at a column density of 1 M⊙ pc−2. The beam size (FWHM) of the H I data is indicated in the bottom-left corner of each panel.
Current usage metrics show cumulative count of Article Views (full-text article views including HTML views, PDF and ePub downloads, according to the available data) and Abstracts Views on Vision4Press platform.
Data correspond to usage on the plateform after 2015. The current usage metrics is available 48-96 hours after online publication and is updated daily on week days.
Initial download of the metrics may take a while.