Fig. 10.
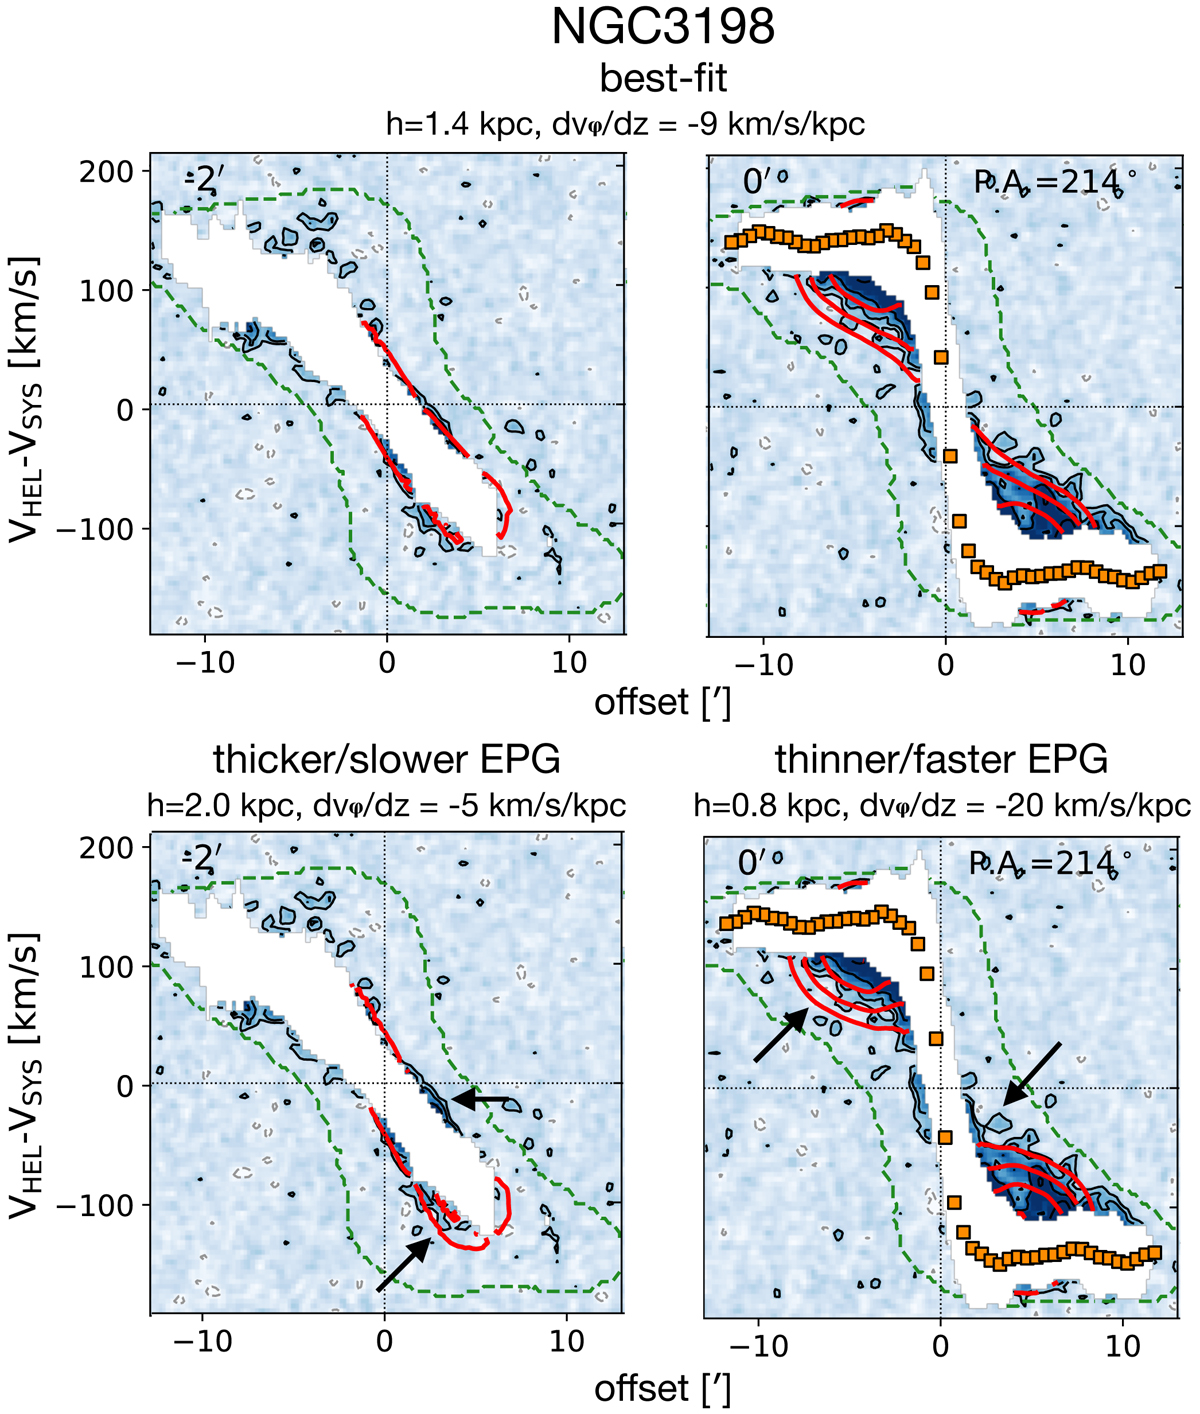
Comparison between the best-fit model for the EPG of NGC 3198 (top panels) and two models that use the same parameters but different values for h and dvϕ/dz (bottom panels). Contours are the same as in Fig. 6. Arrows show the locations where the models are inferior to the best-fit one. We have focussed on pv-slices where the differences are more evident.
Current usage metrics show cumulative count of Article Views (full-text article views including HTML views, PDF and ePub downloads, according to the available data) and Abstracts Views on Vision4Press platform.
Data correspond to usage on the plateform after 2015. The current usage metrics is available 48-96 hours after online publication and is updated daily on week days.
Initial download of the metrics may take a while.