Fig. 3
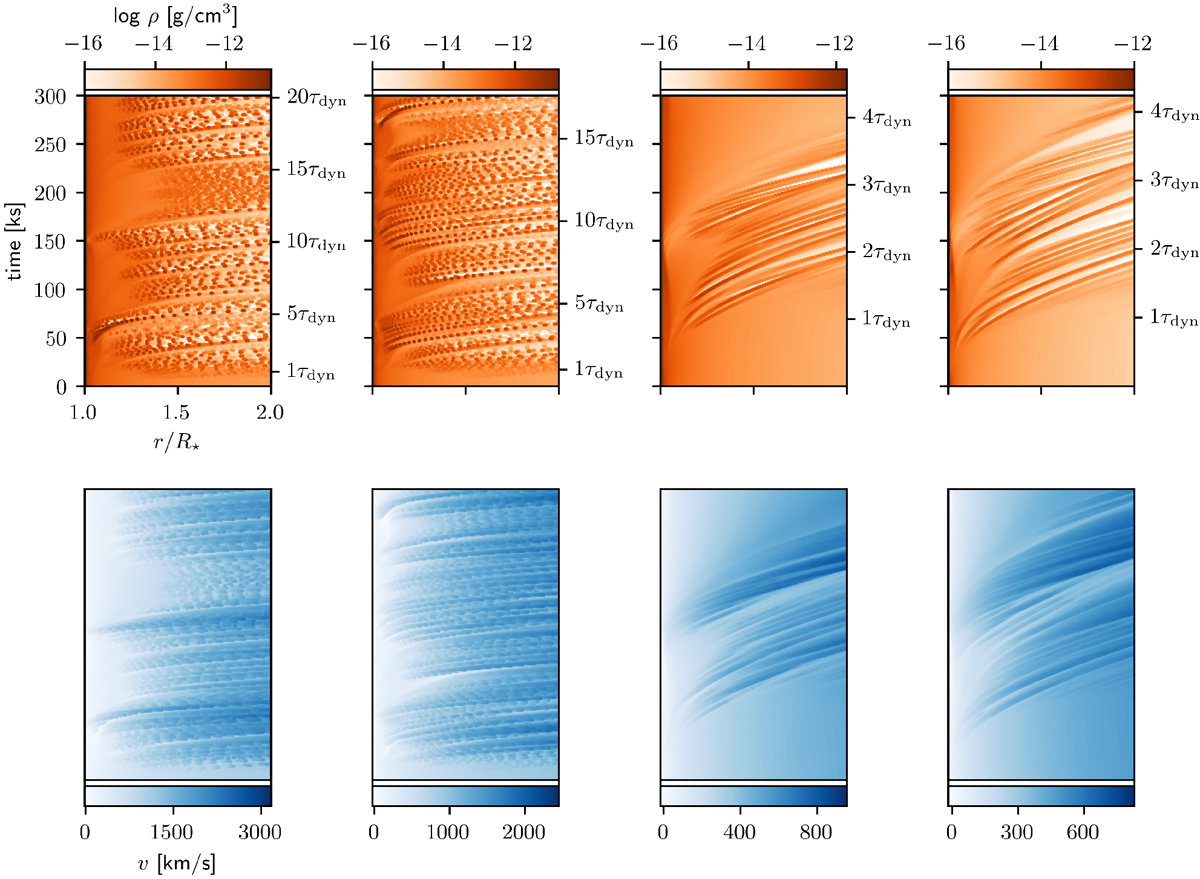
Top row: logarithmic wind density structure. From left to right: OSG1, OSG2, BSG1, BSG2. Bottom row: wind velocity structure of the corresponding models. The rarefied medium in the density plot is characterized by high velocities, while the dense clumps move at much lower velocities. All models extend to 300 ks, but the B supergiant models actually run for a much longer time (see text). Also illustrated is the difference in dynamical timescale that governs the onset of structure formation.
Current usage metrics show cumulative count of Article Views (full-text article views including HTML views, PDF and ePub downloads, according to the available data) and Abstracts Views on Vision4Press platform.
Data correspond to usage on the plateform after 2015. The current usage metrics is available 48-96 hours after online publication and is updated daily on week days.
Initial download of the metrics may take a while.