Fig. 8
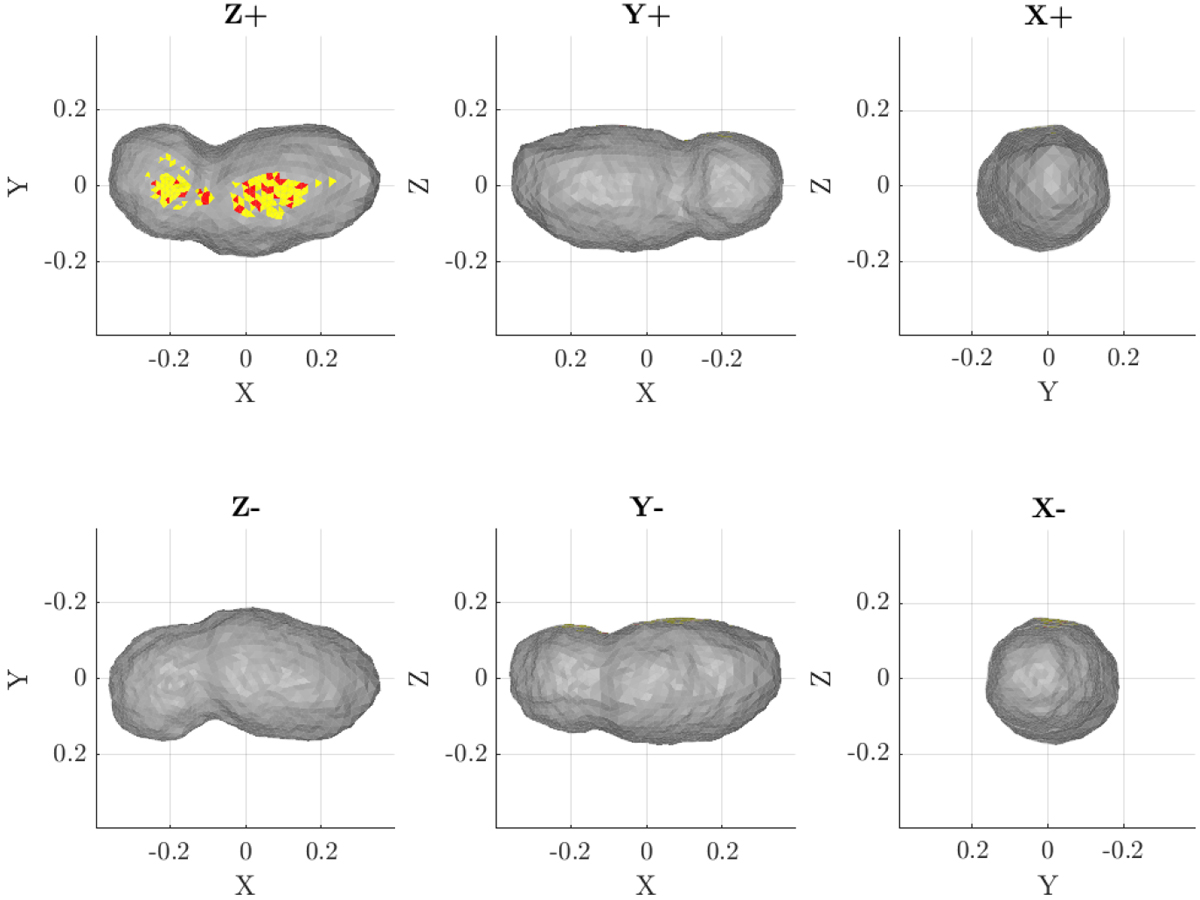
Sameas Fig. 3, but for the best-fit final radar shape model of (85990) 1999 JV6. The X, Y, and Z axes are in kilometres. This model best reproduces the combined light curve and radar data set, with the rotation pole located at λ = 132°, β = −86 °, corresponding to a solution with a χ2 within 1% of the best solution from the search depicted in Fig. 6. Combining radar with optical light-curve data provides excellent viewing geometry coverage, meaning more than 99% of the asteroid surface was observed. The red areas represent the surface elements that were not observed by either radar imaging or light curves. The yellow colour marks regions that were not observed by radar but were observed using light curves. The ‘Y-’ view shows an indentation in the largerlobe.
Current usage metrics show cumulative count of Article Views (full-text article views including HTML views, PDF and ePub downloads, according to the available data) and Abstracts Views on Vision4Press platform.
Data correspond to usage on the plateform after 2015. The current usage metrics is available 48-96 hours after online publication and is updated daily on week days.
Initial download of the metrics may take a while.