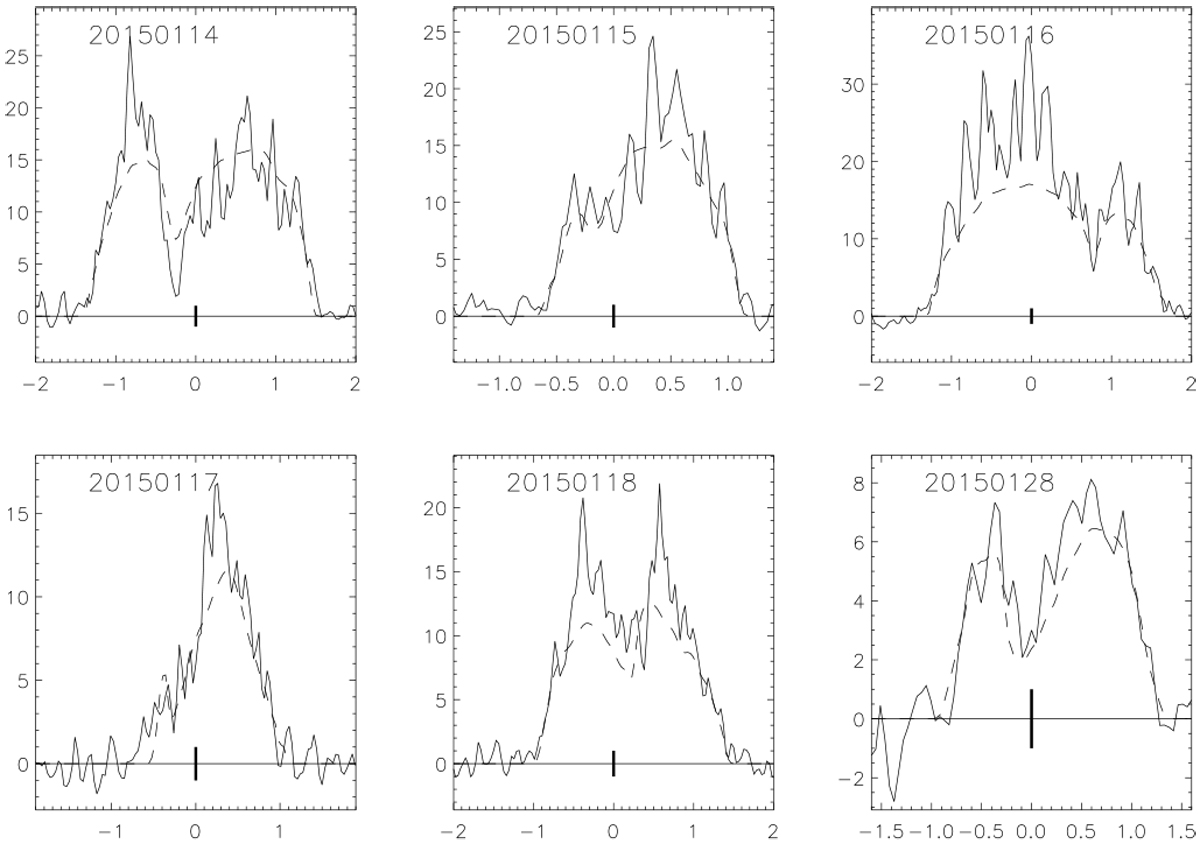
Fig. A.3

The cw radar power spectra of asteroid (85990) 1999 JV6 collected at Arecibo in January 2015. Each panel is a graph of echo power in units of standard deviation of the noise against Doppler frequency offset in Hz (relative to centre of mass). The black bar at the 0 Hz frequency has unit length. Each panel is labelled with the date of observations in [yyyymmdd] format. Solid lines represent observations (received OC spectra), and the dashed line is a simulated echo based on the best-fit radar model (see model summary in Table 3). The details of each spectrum are given in Table A.1.
Current usage metrics show cumulative count of Article Views (full-text article views including HTML views, PDF and ePub downloads, according to the available data) and Abstracts Views on Vision4Press platform.
Data correspond to usage on the plateform after 2015. The current usage metrics is available 48-96 hours after online publication and is updated daily on week days.
Initial download of the metrics may take a while.


