Fig. 1
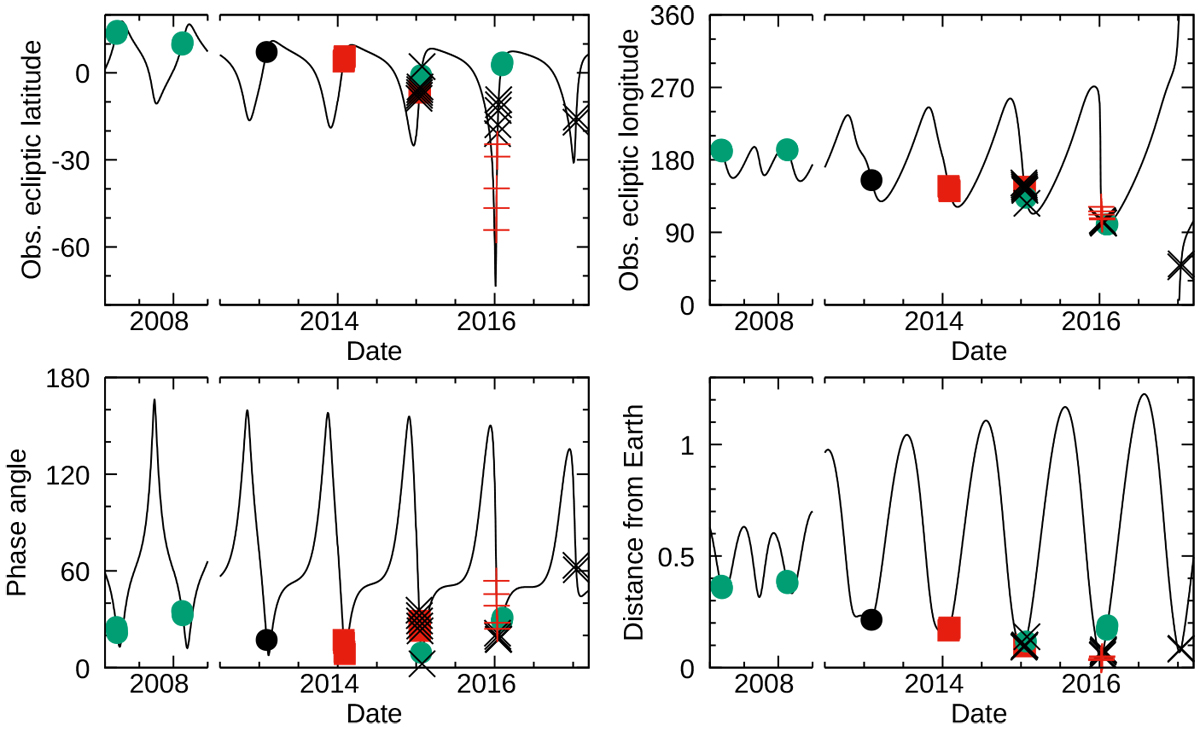
Asteroid (85990) 1999 JV6 observing geometries during the optical and radar observations. The graphs display different quantities as a function of time. Top two panels: positions of the object in the ecliptic coordinate system, latitude and longitude, as observed from Earth. Bottom two panels: phase angle, the angle between the positions of the Earth and Sun as observed from the target, and geocentric distance to the target. Optical light curve data from the NTT are marked with filled black circles, with light-curve data from supporting campaigns marked with filled green circles. Red squares represent the published light-curve data. The black cross symbols mark when the Arecibo radar data were collected, and the red crosses mark Goldstone observations. The black continuous line represents the ephemeris of the object. The break in the Y -axis in all four graphs indicates the gap between June 2008 and July 2012.
Current usage metrics show cumulative count of Article Views (full-text article views including HTML views, PDF and ePub downloads, according to the available data) and Abstracts Views on Vision4Press platform.
Data correspond to usage on the plateform after 2015. The current usage metrics is available 48-96 hours after online publication and is updated daily on week days.
Initial download of the metrics may take a while.