Fig. 9.
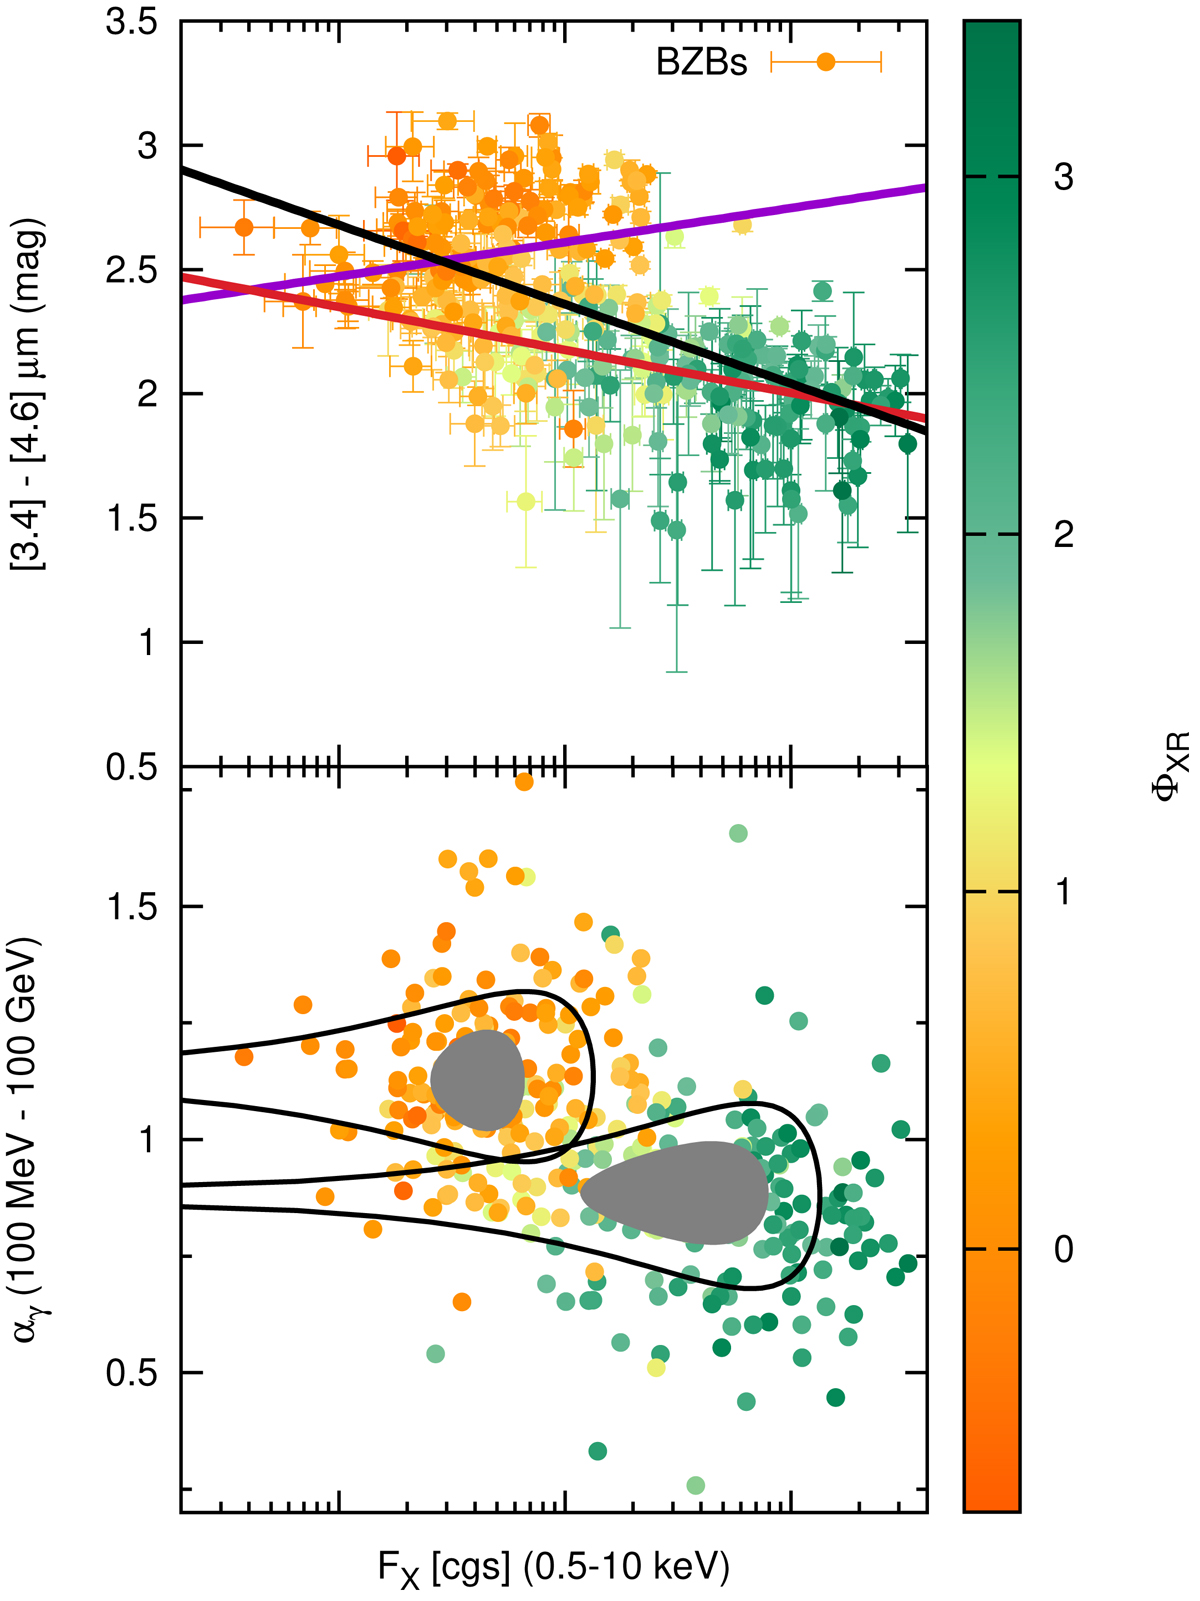
Upper panel: FX in the 0.5−10 keV band vs. the [4.6]−[12] μm mid-infrared color. Selected BZBs are classified as HBLs and LBLs and are marked in green and orange, respectively. Dashed lines indicate regression lines for LBLs (purple), HBLs (red), and the whole sample (black). Lower panel: FX in the 0.5−10 keV band vs. the αγ as reported in the 3FGL. Solid black lines mark the area within one standard deviation centered on the mean, and solid gray shows the area computed with the median absolute deviation centered on the median value.
Current usage metrics show cumulative count of Article Views (full-text article views including HTML views, PDF and ePub downloads, according to the available data) and Abstracts Views on Vision4Press platform.
Data correspond to usage on the plateform after 2015. The current usage metrics is available 48-96 hours after online publication and is updated daily on week days.
Initial download of the metrics may take a while.