Free Access
Fig. 6.
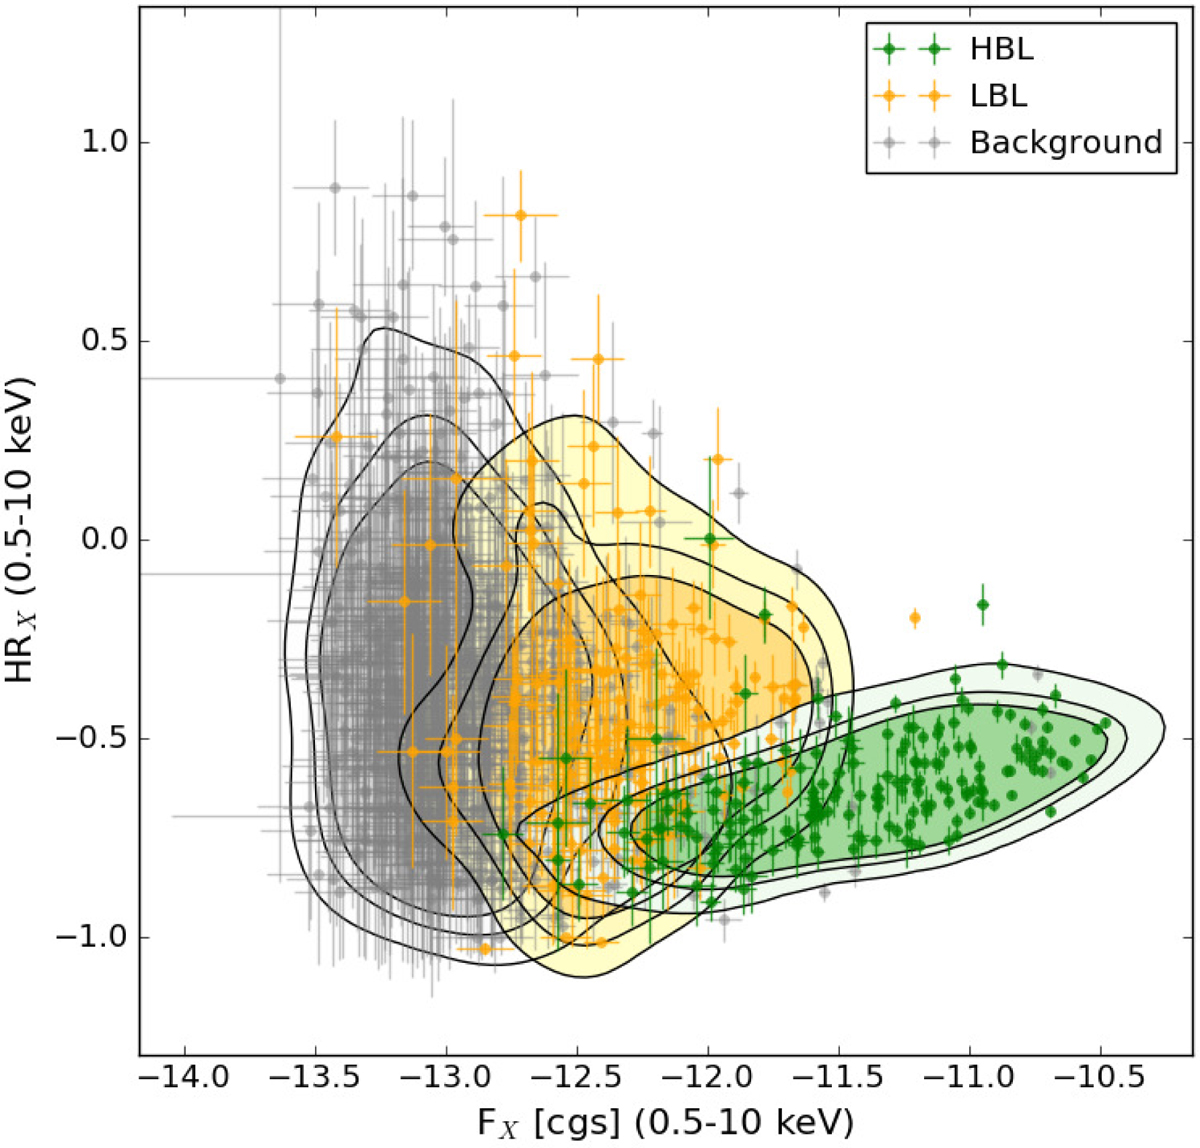
FX in the 0.5−10 keV band vs. HRX for all BZBs in the selected sample, same as in Fig. 5. We show the 70%, 80%, and 90% isodensity contours as obtained from a KDE analysis for background or foreground sources in gray, HBLs in green, and LBLs in orange.
Current usage metrics show cumulative count of Article Views (full-text article views including HTML views, PDF and ePub downloads, according to the available data) and Abstracts Views on Vision4Press platform.
Data correspond to usage on the plateform after 2015. The current usage metrics is available 48-96 hours after online publication and is updated daily on week days.
Initial download of the metrics may take a while.