Fig. 4.
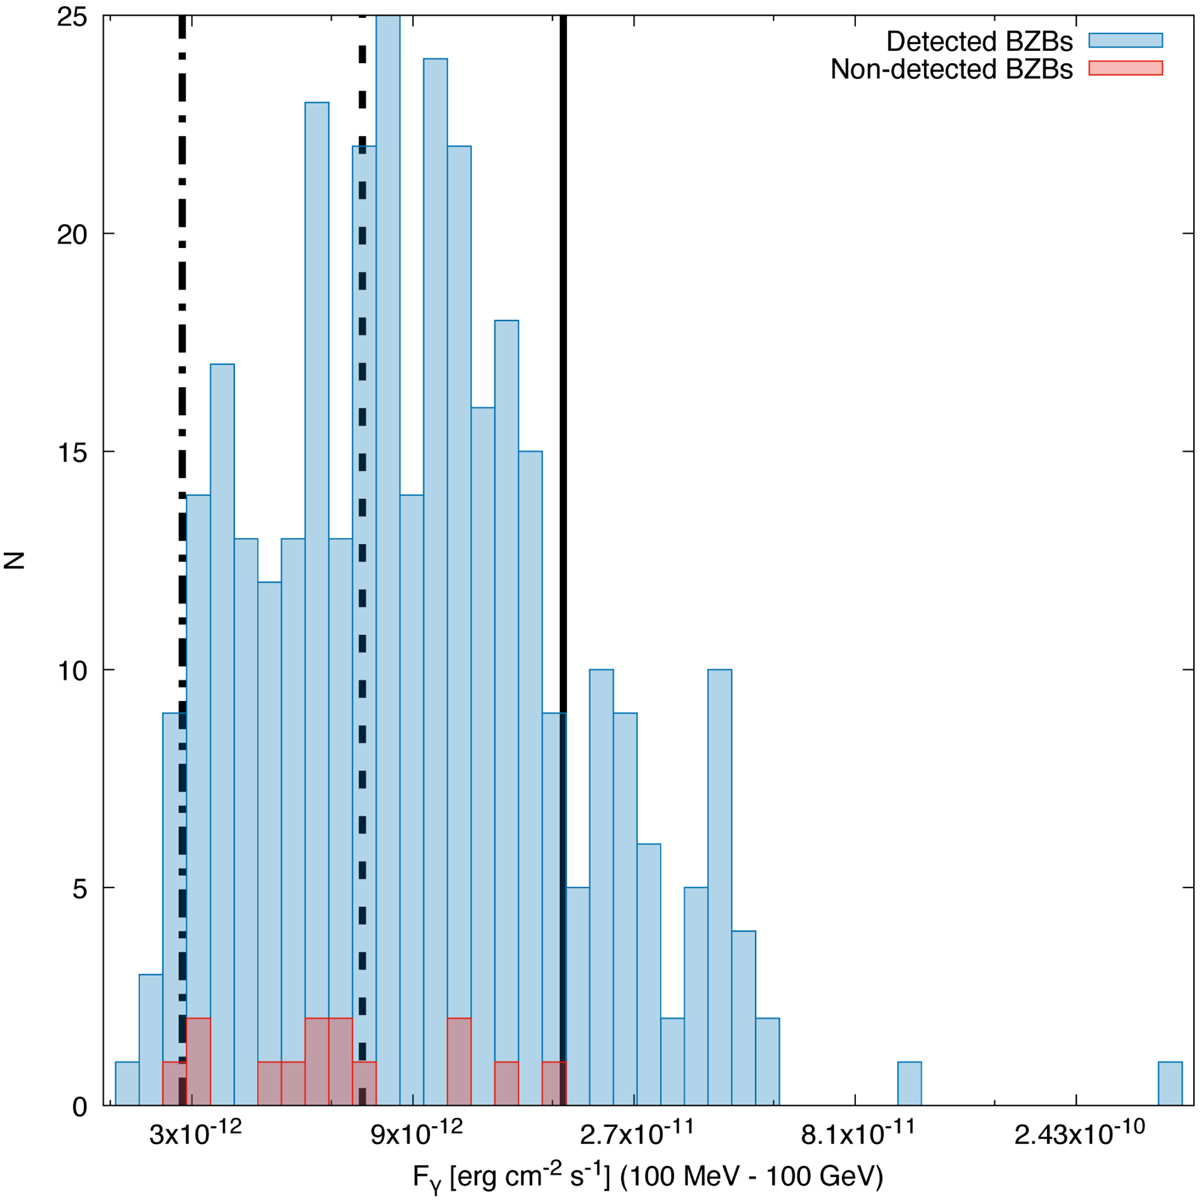
Distribution of Fγ in the 100 MeV−100 GeV band for all 351 BZBs in our selected sample. As in Fig. 2, the blue histogram indicates the X-ray merged event file with at least one X-ray source detected with S/N > 3, and in red we show those without an X-ray detection. The solid black line corresponds to the threshold above which 100% of the selected BZBs has an X-ray counterpart, while the dashed and dot-dashed black lines mark the 98% and 96% thresholds, respectively.
Current usage metrics show cumulative count of Article Views (full-text article views including HTML views, PDF and ePub downloads, according to the available data) and Abstracts Views on Vision4Press platform.
Data correspond to usage on the plateform after 2015. The current usage metrics is available 48-96 hours after online publication and is updated daily on week days.
Initial download of the metrics may take a while.