Free Access
Fig. 2.
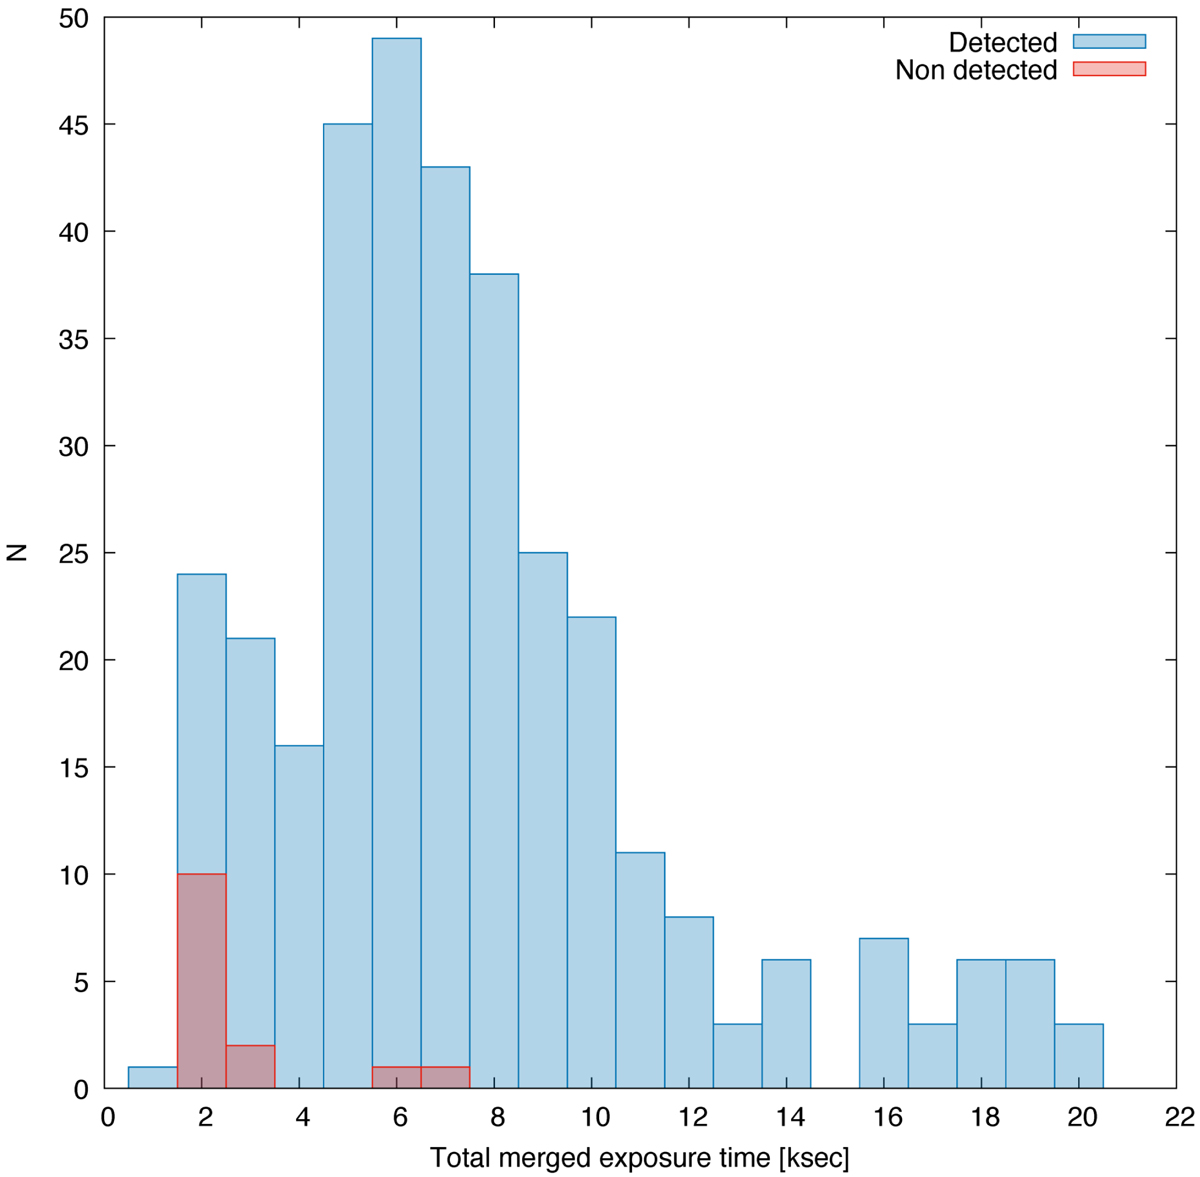
Distribution of the total exposure time for all selected BZBs. The blue histogram indicates the X-ray merged event files with at least one X-ray source detected with an S/N > 3, while in red we show those without an X-ray detection.
Current usage metrics show cumulative count of Article Views (full-text article views including HTML views, PDF and ePub downloads, according to the available data) and Abstracts Views on Vision4Press platform.
Data correspond to usage on the plateform after 2015. The current usage metrics is available 48-96 hours after online publication and is updated daily on week days.
Initial download of the metrics may take a while.