Free Access
Fig. 11.
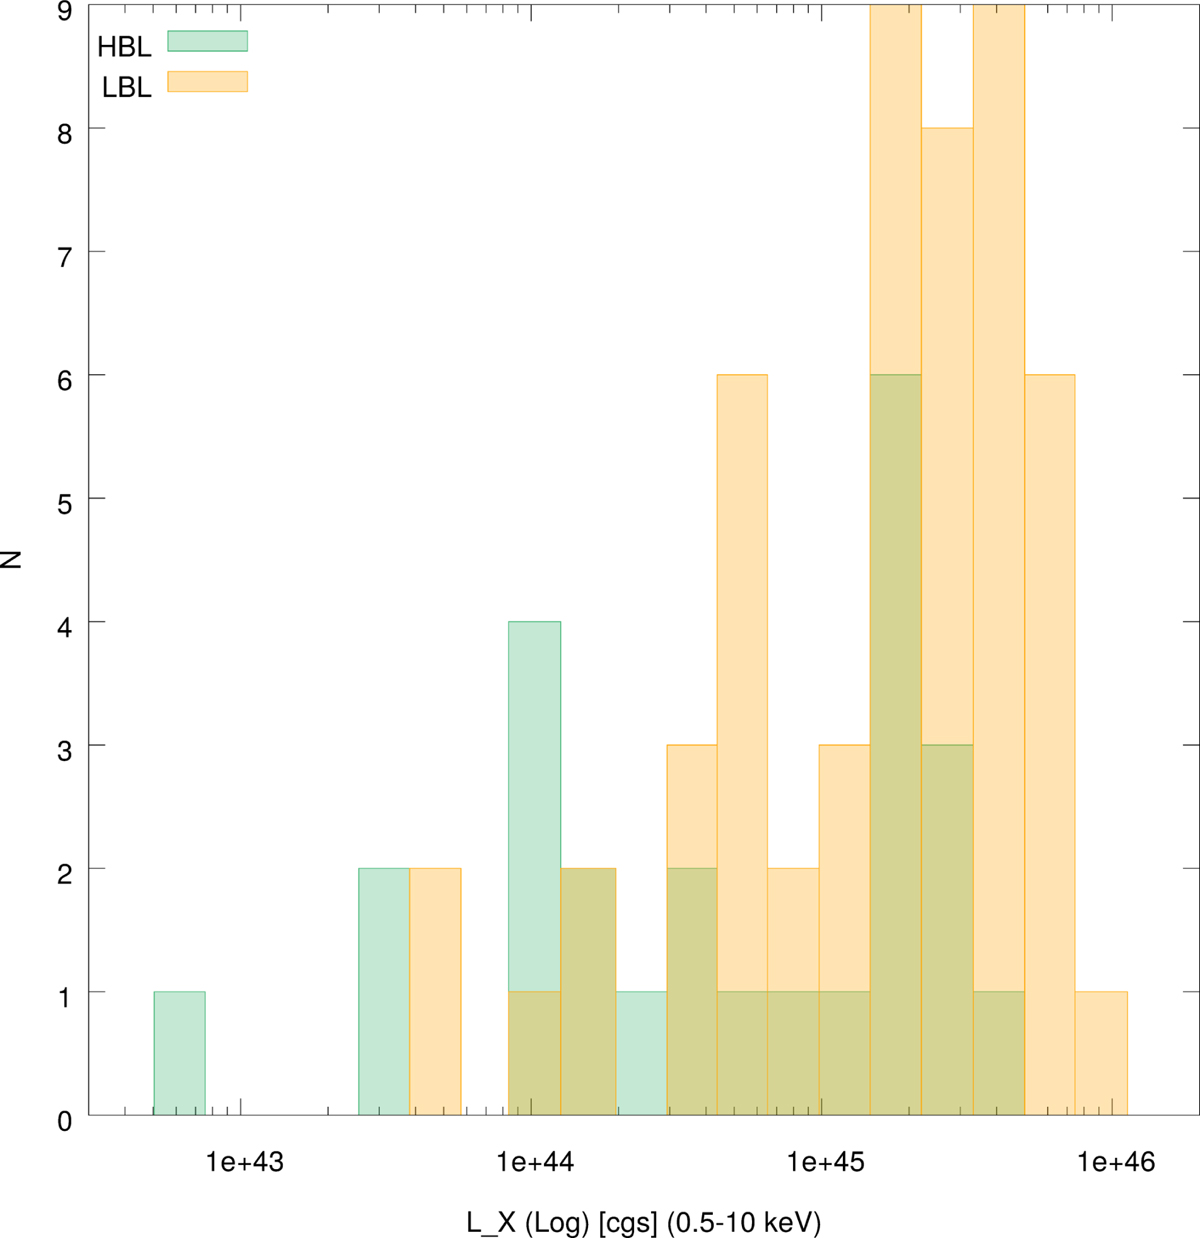
Distribution of LX in the 0.5−10 keV band for the subsample of 77 BZBs with a well-determined redshift estimate reported in the Roma-BZCat (Massaro et al. 2015a). As in previous figures, LBLs are in orange and HBLs in green.
Current usage metrics show cumulative count of Article Views (full-text article views including HTML views, PDF and ePub downloads, according to the available data) and Abstracts Views on Vision4Press platform.
Data correspond to usage on the plateform after 2015. The current usage metrics is available 48-96 hours after online publication and is updated daily on week days.
Initial download of the metrics may take a while.