Fig. 4.
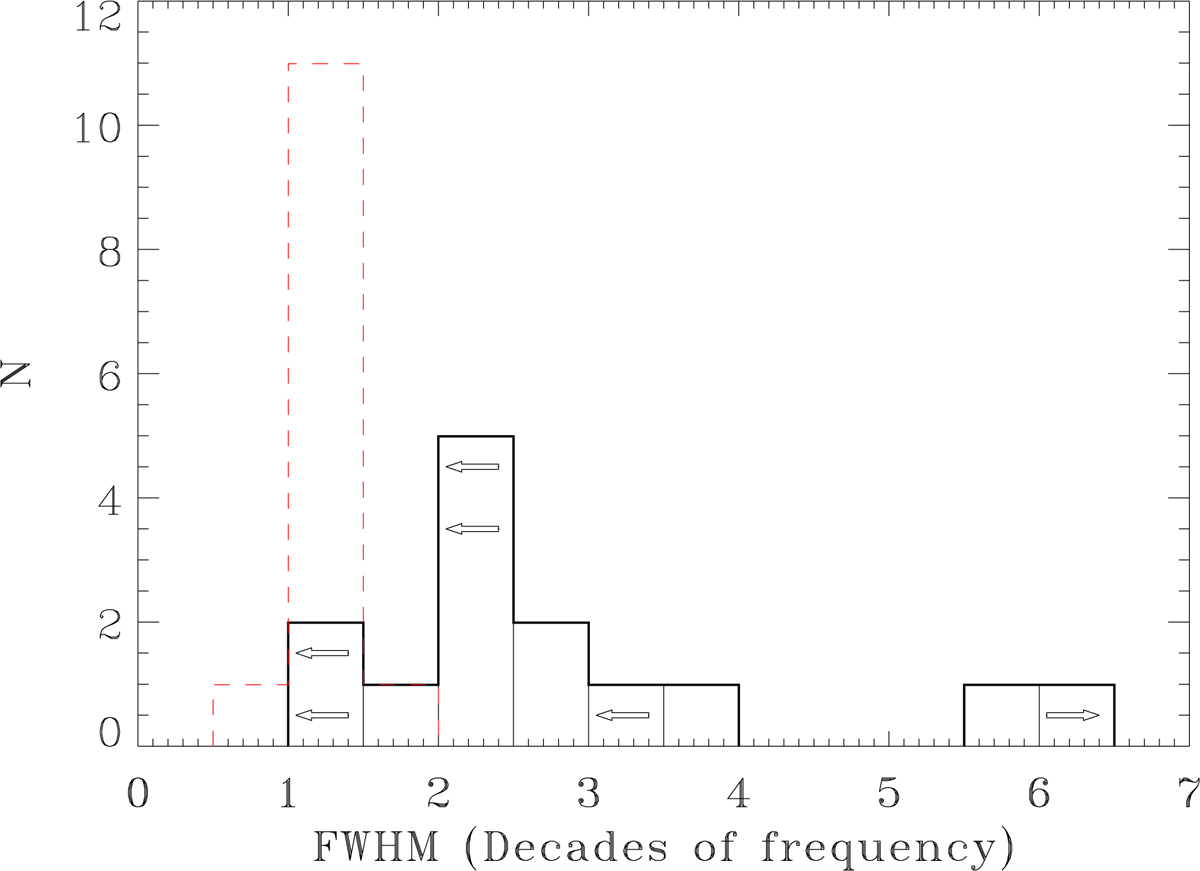
Black histogram: distribution of FWHM (in decades of frequency) of 14 FR 0s with a convex radio spectrum extracted from 19 sources of bright sub-sample with F1.4 > 50 mJy. The left pointing arrows correspond to upper limits of the FWHM due to the non detection at least at one frequency. The right pointing arrow represents the FWHM of J1604+17 whose measured value (12.5) exceeds the plot limit. The dashed red histogram reports the FWHM measured by O’Dea et al. (1991) in a sample of 13 GPS.
Current usage metrics show cumulative count of Article Views (full-text article views including HTML views, PDF and ePub downloads, according to the available data) and Abstracts Views on Vision4Press platform.
Data correspond to usage on the plateform after 2015. The current usage metrics is available 48-96 hours after online publication and is updated daily on week days.
Initial download of the metrics may take a while.