Fig. 2.
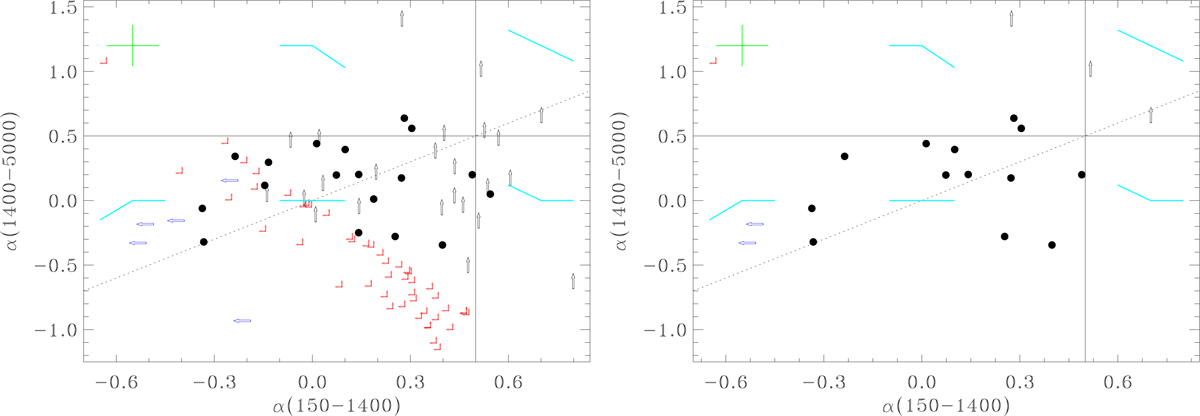
Left: comparison of spectral indices measured between 150 MHz and 1.4 GHz and 1.4 and 5 GHz. The double red arrows indicate objects only detected at 1.4 GHz, the blue arrows indicate those detected at 1.4 and 5 GHz, but not at 150 MHz, the black arrows indicate those detected at 150 MHz and 1.4 GHz, but not at 5 GHz. The solid lines separate flat (α < 0.5) and steep sources. Sources located above the dotted line (marking an equal value of the two spectral indices) are objects with a convex spectrum. The green cross on the upper left corner represents the maximum error, corresponding to the sources with flux density equal to 5 × σ in both TGSS and GB6. The cyan broken lines reproduce the typical spectral shape in different regions of the diagram. Right: same as left panel but limited to 19 sources with F1.4 > 50 mJy.
Current usage metrics show cumulative count of Article Views (full-text article views including HTML views, PDF and ePub downloads, according to the available data) and Abstracts Views on Vision4Press platform.
Data correspond to usage on the plateform after 2015. The current usage metrics is available 48-96 hours after online publication and is updated daily on week days.
Initial download of the metrics may take a while.