Free Access
Fig. 1.
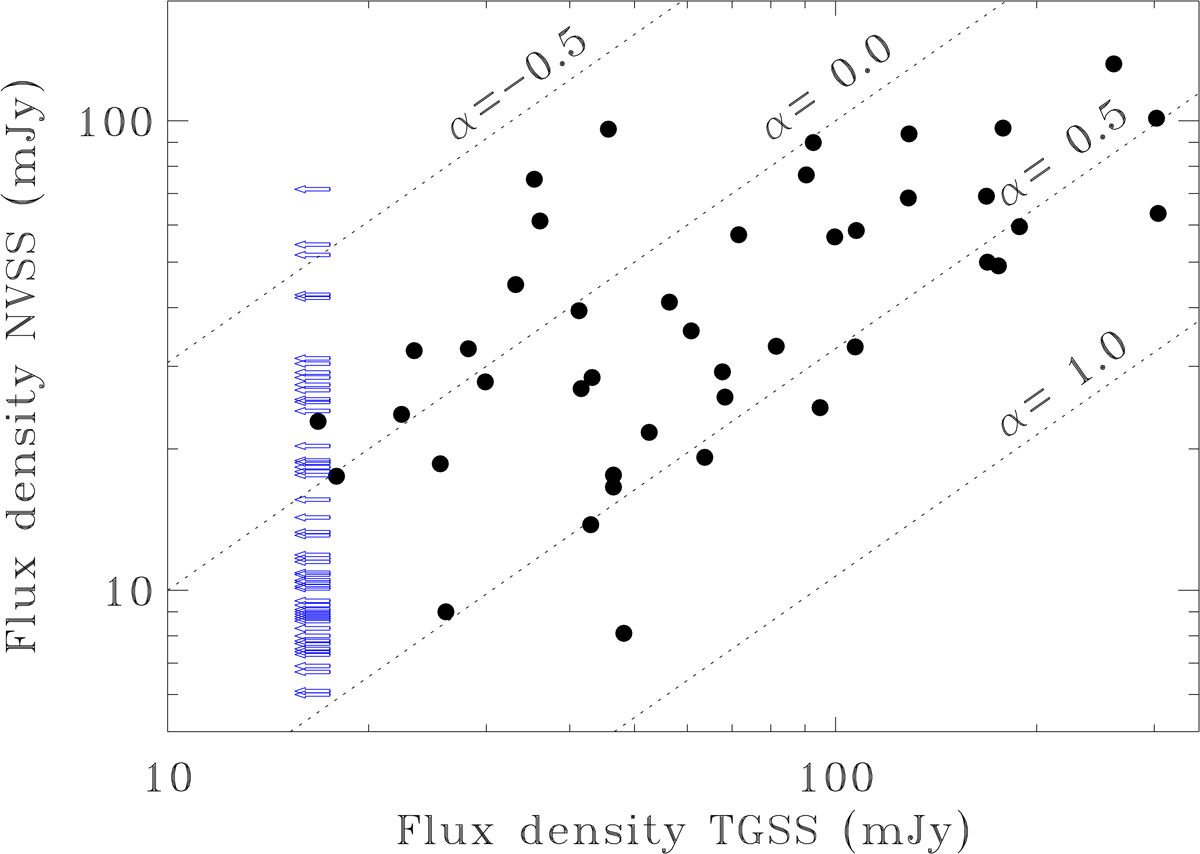
Comparison of flux densities of FR0CAT sources at 150 MHz and 1.4 GHz from TGSS and NVSS, respectively. The dotted lines represent loci of constant spectral indices α (defined as Fν ∝ ν−α) at the values indicated. The blue, left pointing arrows represent the upper limits in the TGSS.
Current usage metrics show cumulative count of Article Views (full-text article views including HTML views, PDF and ePub downloads, according to the available data) and Abstracts Views on Vision4Press platform.
Data correspond to usage on the plateform after 2015. The current usage metrics is available 48-96 hours after online publication and is updated daily on week days.
Initial download of the metrics may take a while.