Fig. 2.
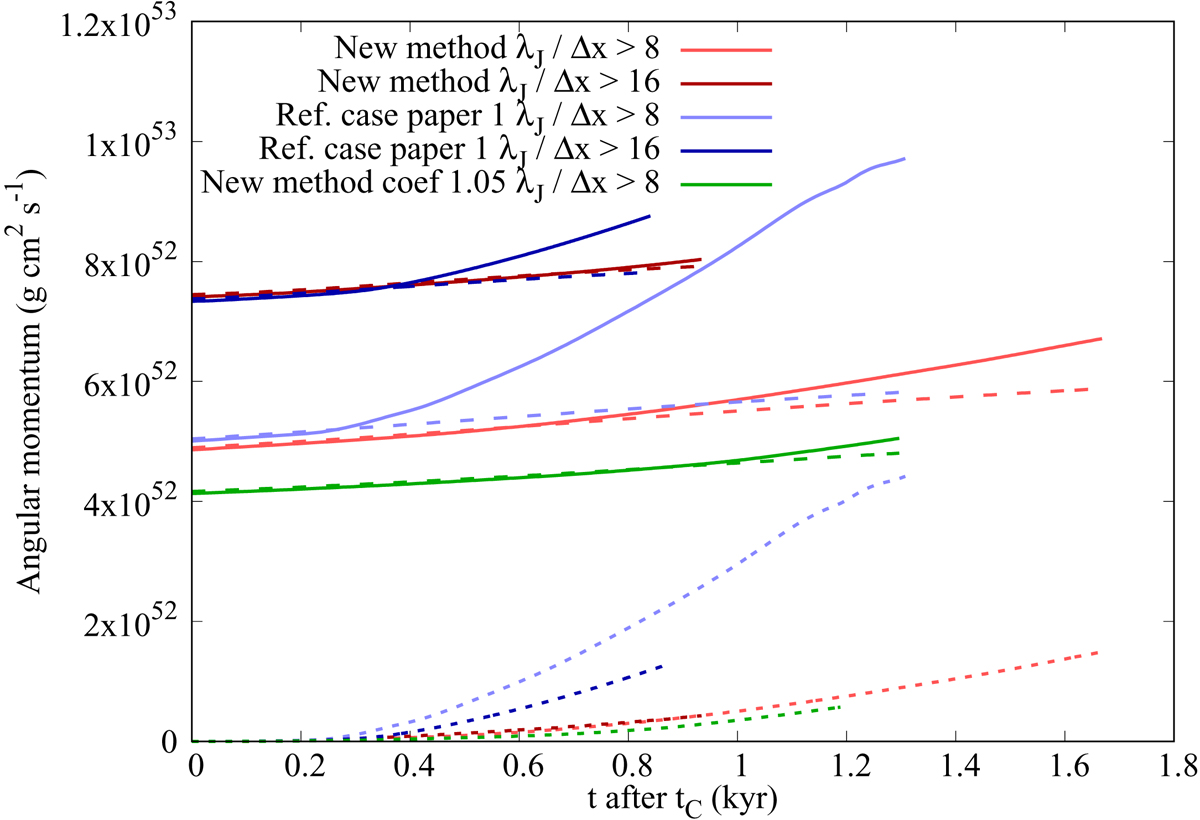
Evolution of the positive and negative angular momentum (![]() and
and ![]() ) in solid and dashed line respectively. Dotted lines indicate the angular momentum of the disk. The blue lines represent the reference case of Paper I, while the red and green lines show the evolution for the modified scheme, for a moncen coefficient of 1.5 and 1.05 respectively. The lower resolution simulations with 8 points per Jeans length are in light colors and higher resolution simulations with 16 points per Jeans length are in darker colors.
) in solid and dashed line respectively. Dotted lines indicate the angular momentum of the disk. The blue lines represent the reference case of Paper I, while the red and green lines show the evolution for the modified scheme, for a moncen coefficient of 1.5 and 1.05 respectively. The lower resolution simulations with 8 points per Jeans length are in light colors and higher resolution simulations with 16 points per Jeans length are in darker colors.
Current usage metrics show cumulative count of Article Views (full-text article views including HTML views, PDF and ePub downloads, according to the available data) and Abstracts Views on Vision4Press platform.
Data correspond to usage on the plateform after 2015. The current usage metrics is available 48-96 hours after online publication and is updated daily on week days.
Initial download of the metrics may take a while.