Fig. 8.
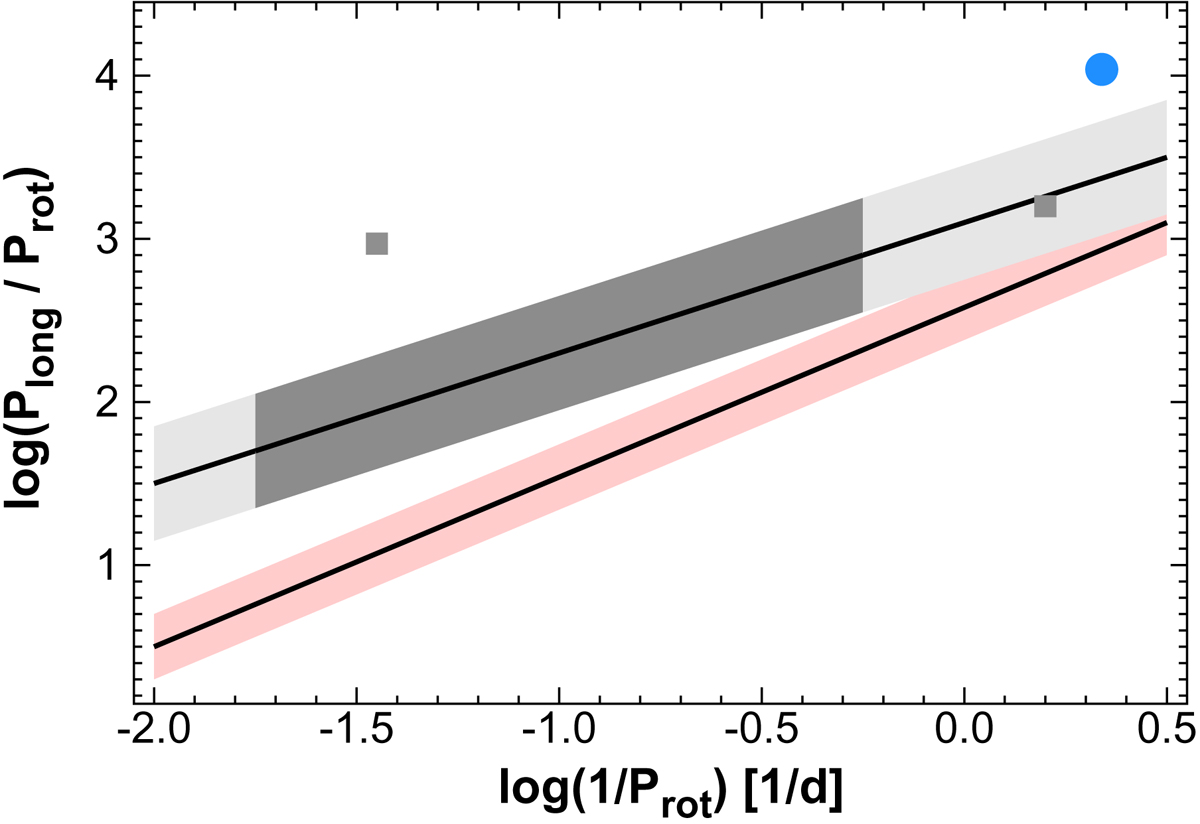
Position of KIC 9832227 (light blue dot) on the schematic diagram relating the rotation frequency to the ratio of the period of the long-term cyclic luminosity variation due to stellar activity to the rotation period. The shaded area covers the data points shown by Almeida et al. (2019), based on the studies of Vida et al. (2013, 2014), Oláh et al. (2009), and Savanov (2012). Shown are red dwarfs (pink) and other stars (dark gray), with the extension to non-populated regions (light gray). Isolated small gray squares indicate objects distinct from the bulk of the sample.
Current usage metrics show cumulative count of Article Views (full-text article views including HTML views, PDF and ePub downloads, according to the available data) and Abstracts Views on Vision4Press platform.
Data correspond to usage on the plateform after 2015. The current usage metrics is available 48-96 hours after online publication and is updated daily on week days.
Initial download of the metrics may take a while.