Fig. 7.
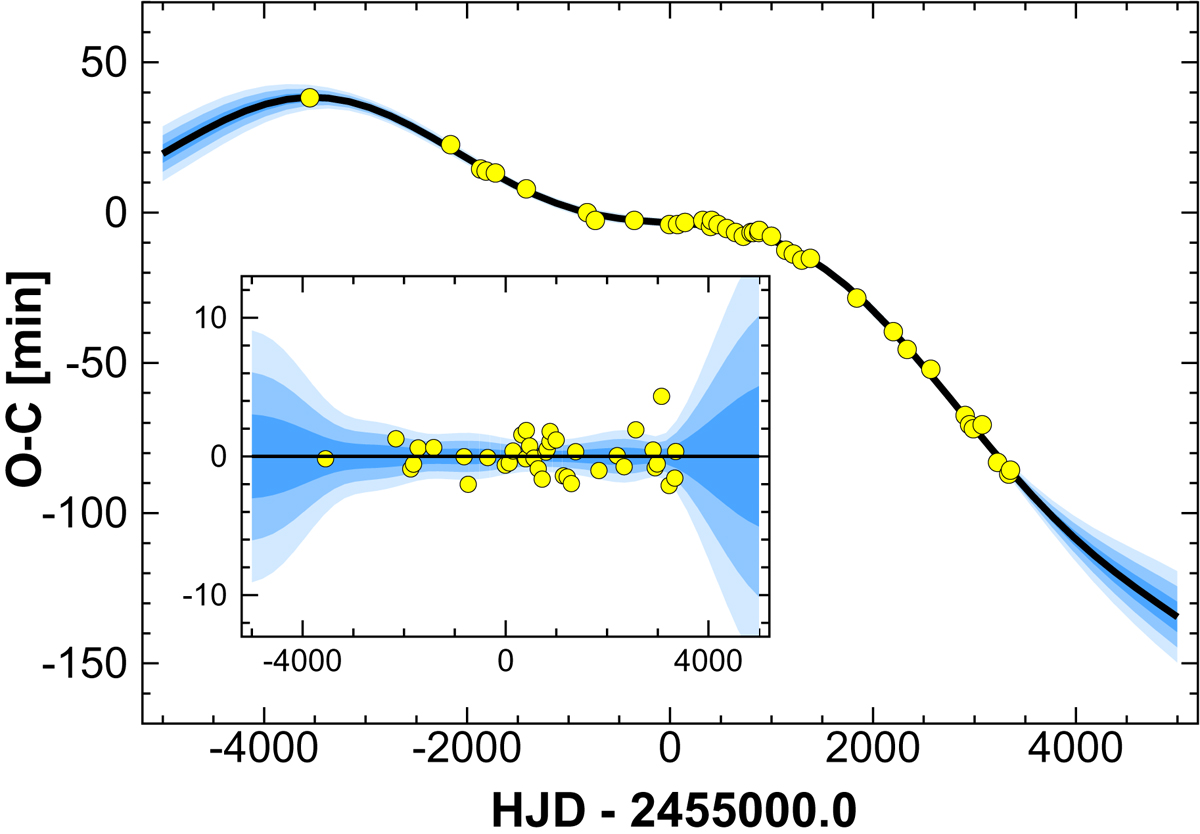
Polynomial plus sinusoidal fit (thick black line) of the observed O–C values (yellow dots, OC4 in Table 1). From darker to lighter shading, the blue regions show the 1, 2 and 3σ limits of the predicted O–C ranges, assuming errors in all estimated parameters, including P2, the period of the long-term variation. The inset shows the deviation from the best fit to the currently available data.
Current usage metrics show cumulative count of Article Views (full-text article views including HTML views, PDF and ePub downloads, according to the available data) and Abstracts Views on Vision4Press platform.
Data correspond to usage on the plateform after 2015. The current usage metrics is available 48-96 hours after online publication and is updated daily on week days.
Initial download of the metrics may take a while.