Free Access
Fig. 6.
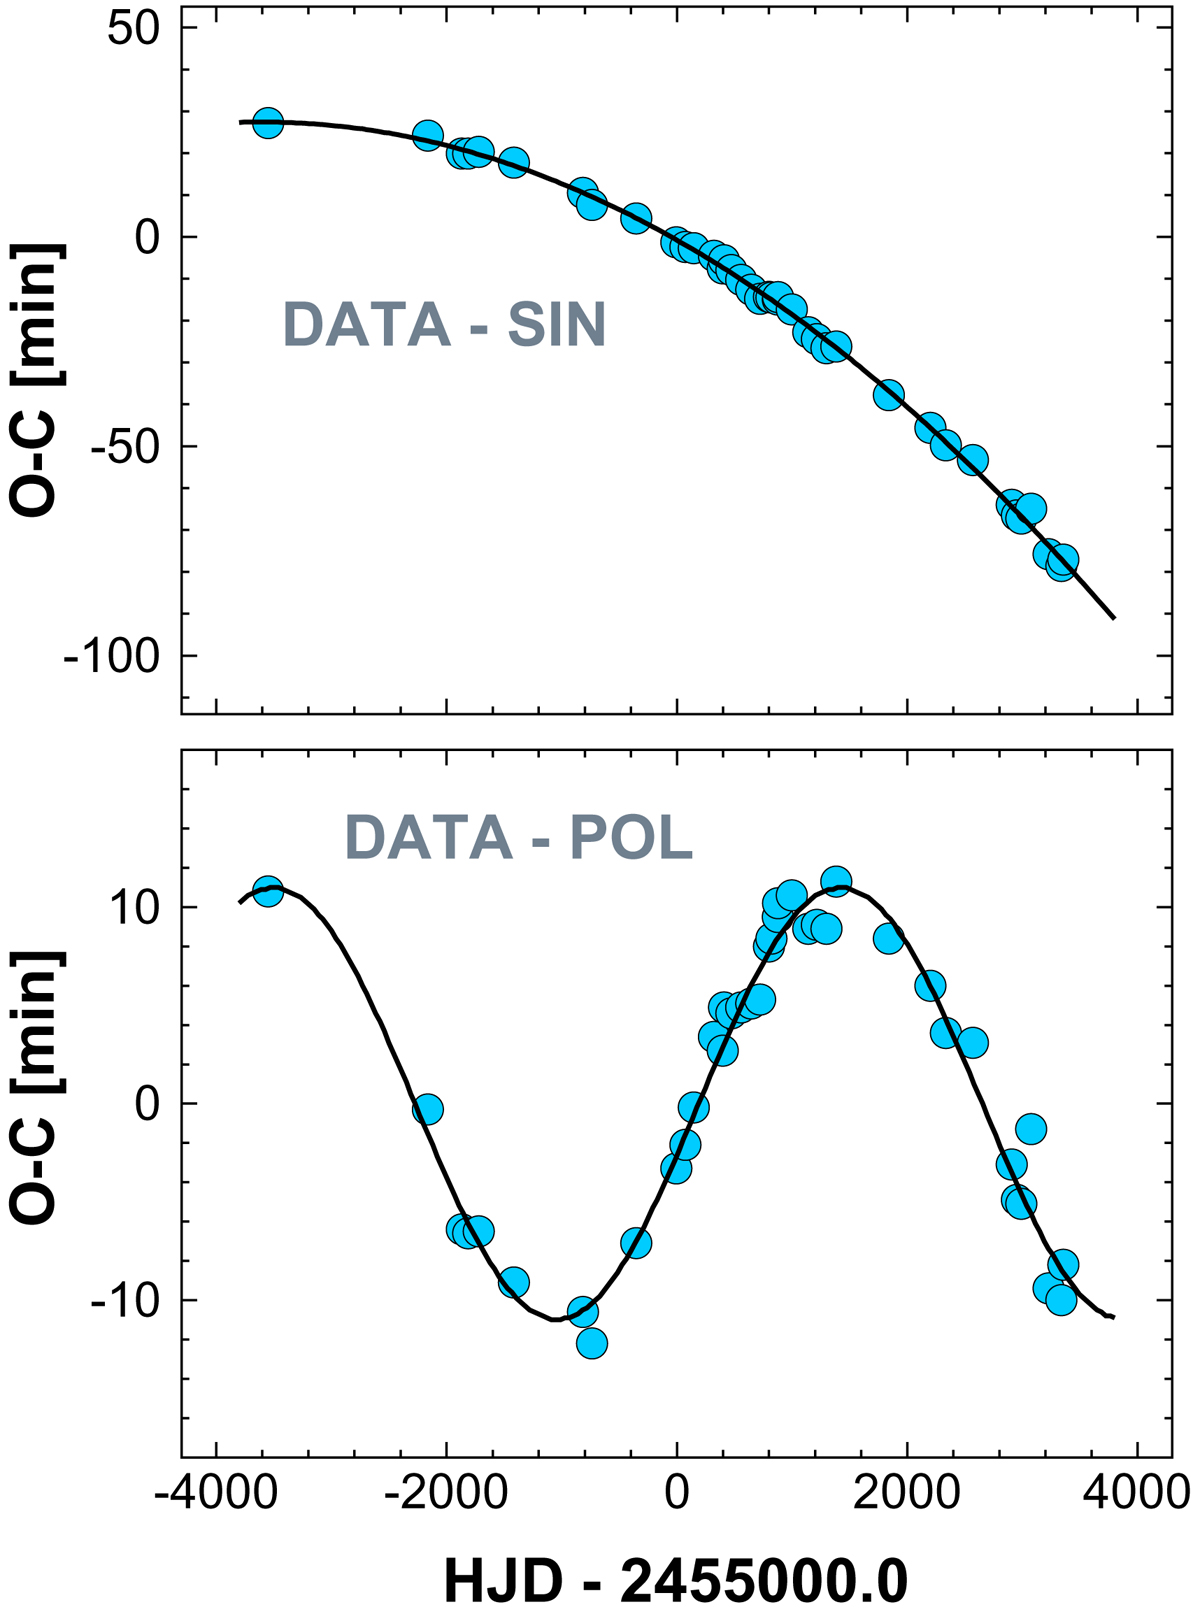
Result of the joint fit of a second-order polynomial and a single sinusoidal to the data shown Fig. 4. The data plotted in the upper panel are free from the sinusoidal, whereas those shown in the lower panel from the polynomial component. See Table 3 for the regression coefficients of these components.
Current usage metrics show cumulative count of Article Views (full-text article views including HTML views, PDF and ePub downloads, according to the available data) and Abstracts Views on Vision4Press platform.
Data correspond to usage on the plateform after 2015. The current usage metrics is available 48-96 hours after online publication and is updated daily on week days.
Initial download of the metrics may take a while.