Fig. 5.
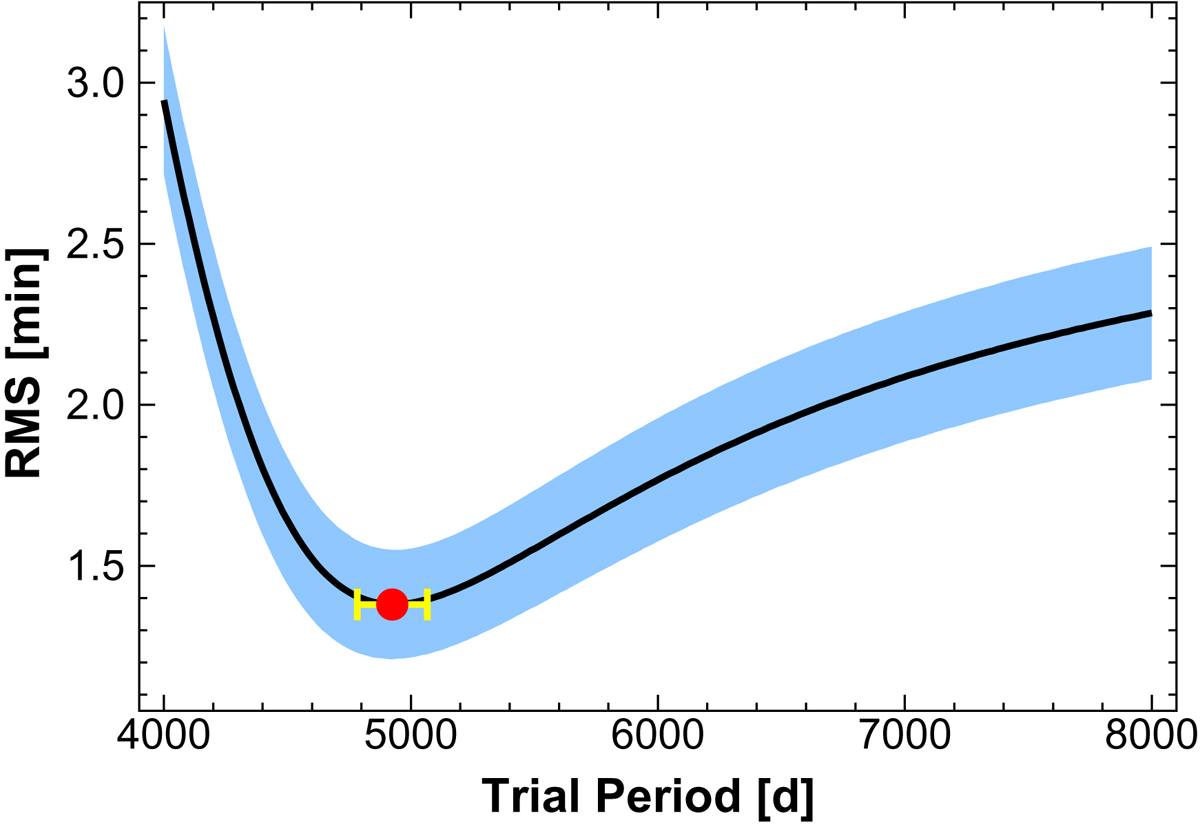
Period scan of the O–C data obtained by the template fit method (see column OC4 of Table 1). Eq. (2) is used to find the minimum rms of the residuals (black line). Shown are the 1σ ranges of the residuals of the simple Monte Carlo simulations (shaded area) and the optimum period and its 1σ error from the above simulations (red dot and error bar).
Current usage metrics show cumulative count of Article Views (full-text article views including HTML views, PDF and ePub downloads, according to the available data) and Abstracts Views on Vision4Press platform.
Data correspond to usage on the plateform after 2015. The current usage metrics is available 48-96 hours after online publication and is updated daily on week days.
Initial download of the metrics may take a while.