Fig. 3.
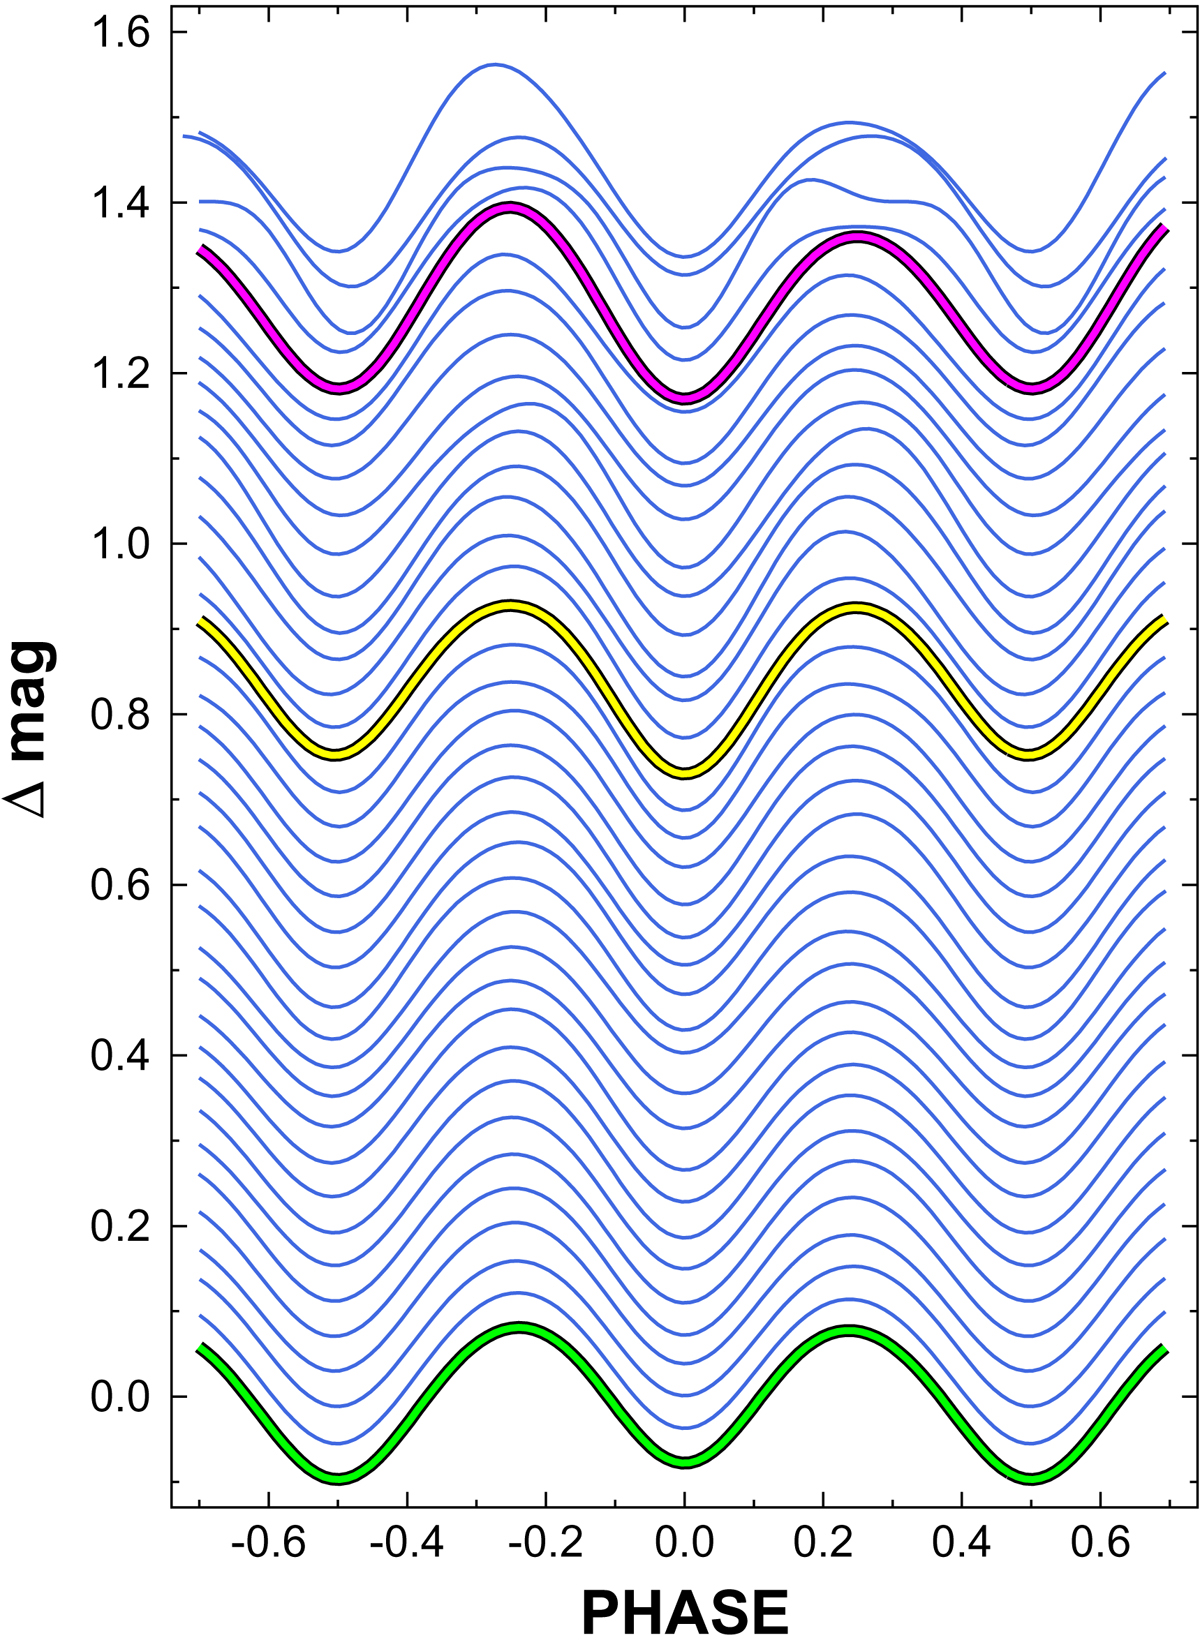
Fourier-fitted synthetic light curves of all 37 data segments analyzed in this paper. The primary minima are shifted to zero phase. The time series are ordered on the basis of the closest neighbor, as described in Sect. 2. The pre-selected templates are shown by distinct colors. Following the notation of Table 1, the green, yellow, and magenta lines show the Fourier fits corresponding to segments Kepler-4, AAVSO-V-1, and AAVSO-V-4, respectively.
Current usage metrics show cumulative count of Article Views (full-text article views including HTML views, PDF and ePub downloads, according to the available data) and Abstracts Views on Vision4Press platform.
Data correspond to usage on the plateform after 2015. The current usage metrics is available 48-96 hours after online publication and is updated daily on week days.
Initial download of the metrics may take a while.