Fig. B.1.
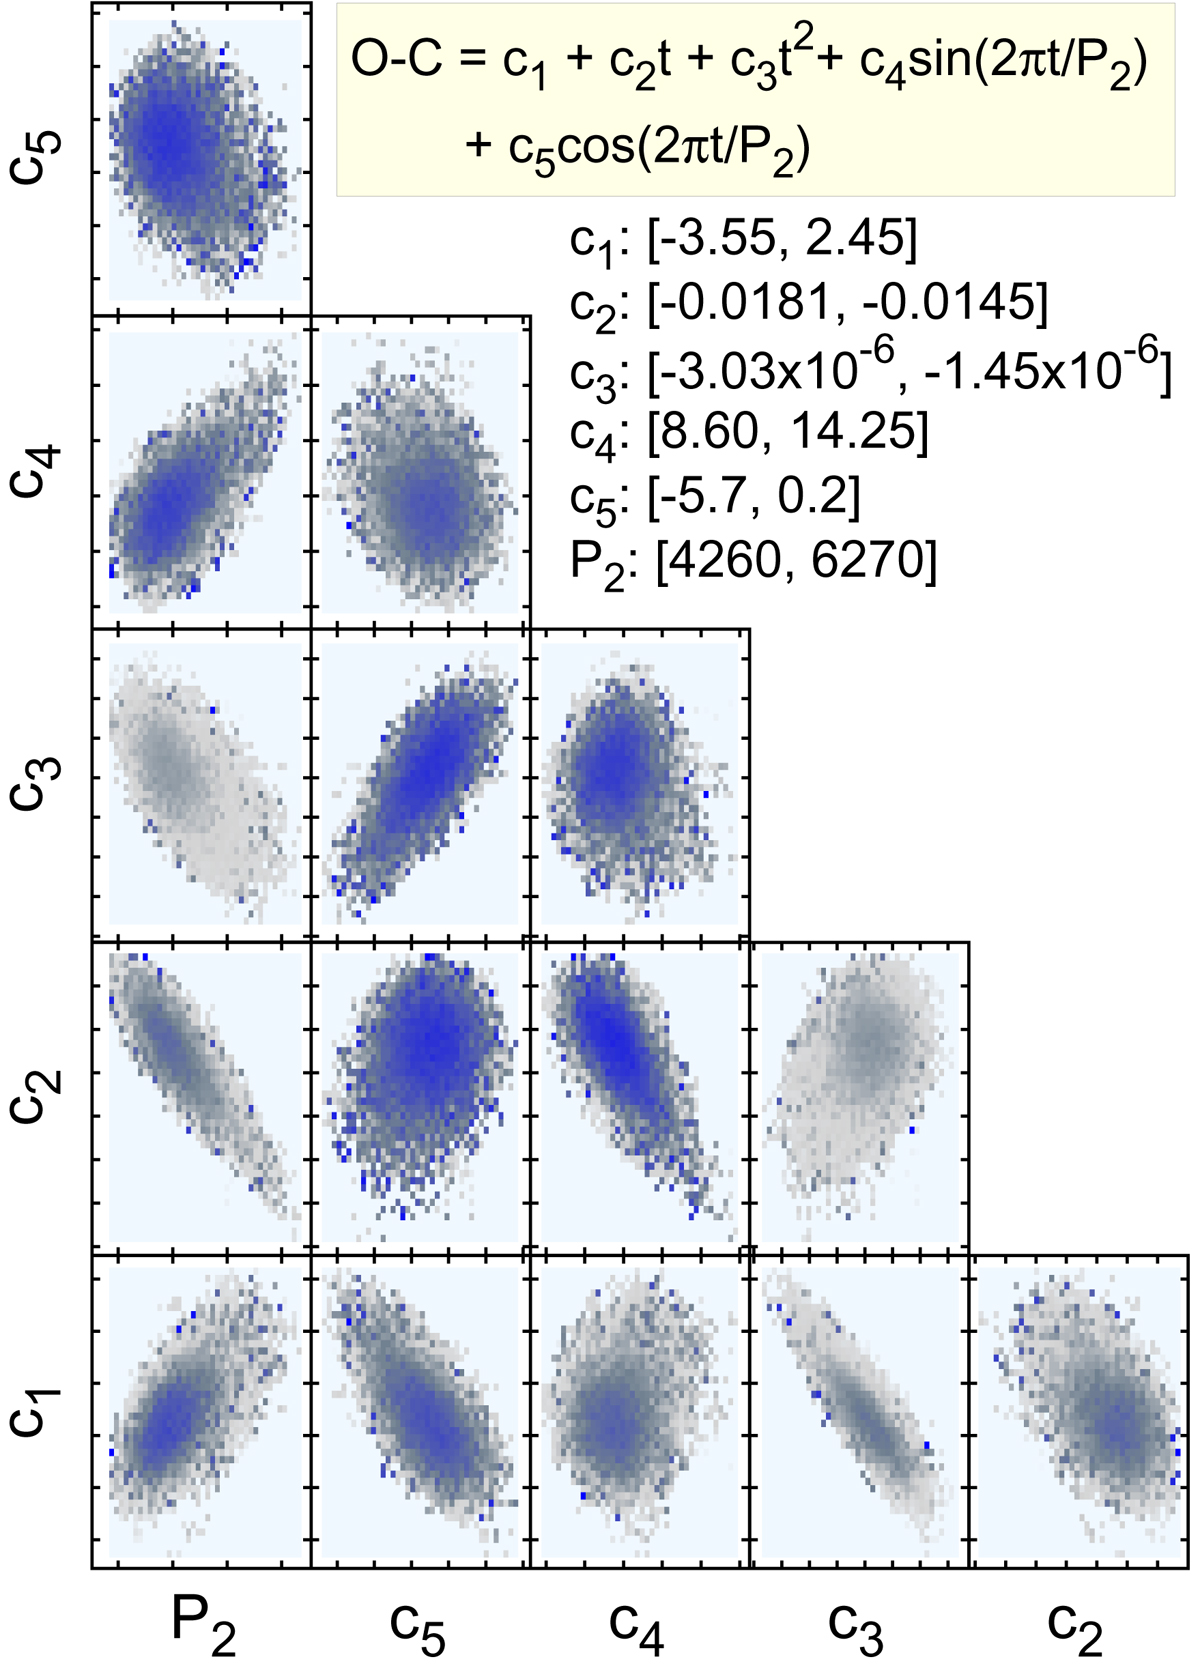
Diagnostic diagram based on the MCMC solution of the fit of the polynomial plus sinusoidal model (see inset) of the observed O–C values (see Table 1). Dots are color-coded according to the χ2 values: blue dots have the lowest χ2, whereas the gray dots (from dark to light) are associated with the less probable solutions. The parameter ranges of the plots are given in the inset.
Current usage metrics show cumulative count of Article Views (full-text article views including HTML views, PDF and ePub downloads, according to the available data) and Abstracts Views on Vision4Press platform.
Data correspond to usage on the plateform after 2015. The current usage metrics is available 48-96 hours after online publication and is updated daily on week days.
Initial download of the metrics may take a while.