Free Access
Fig. 14.
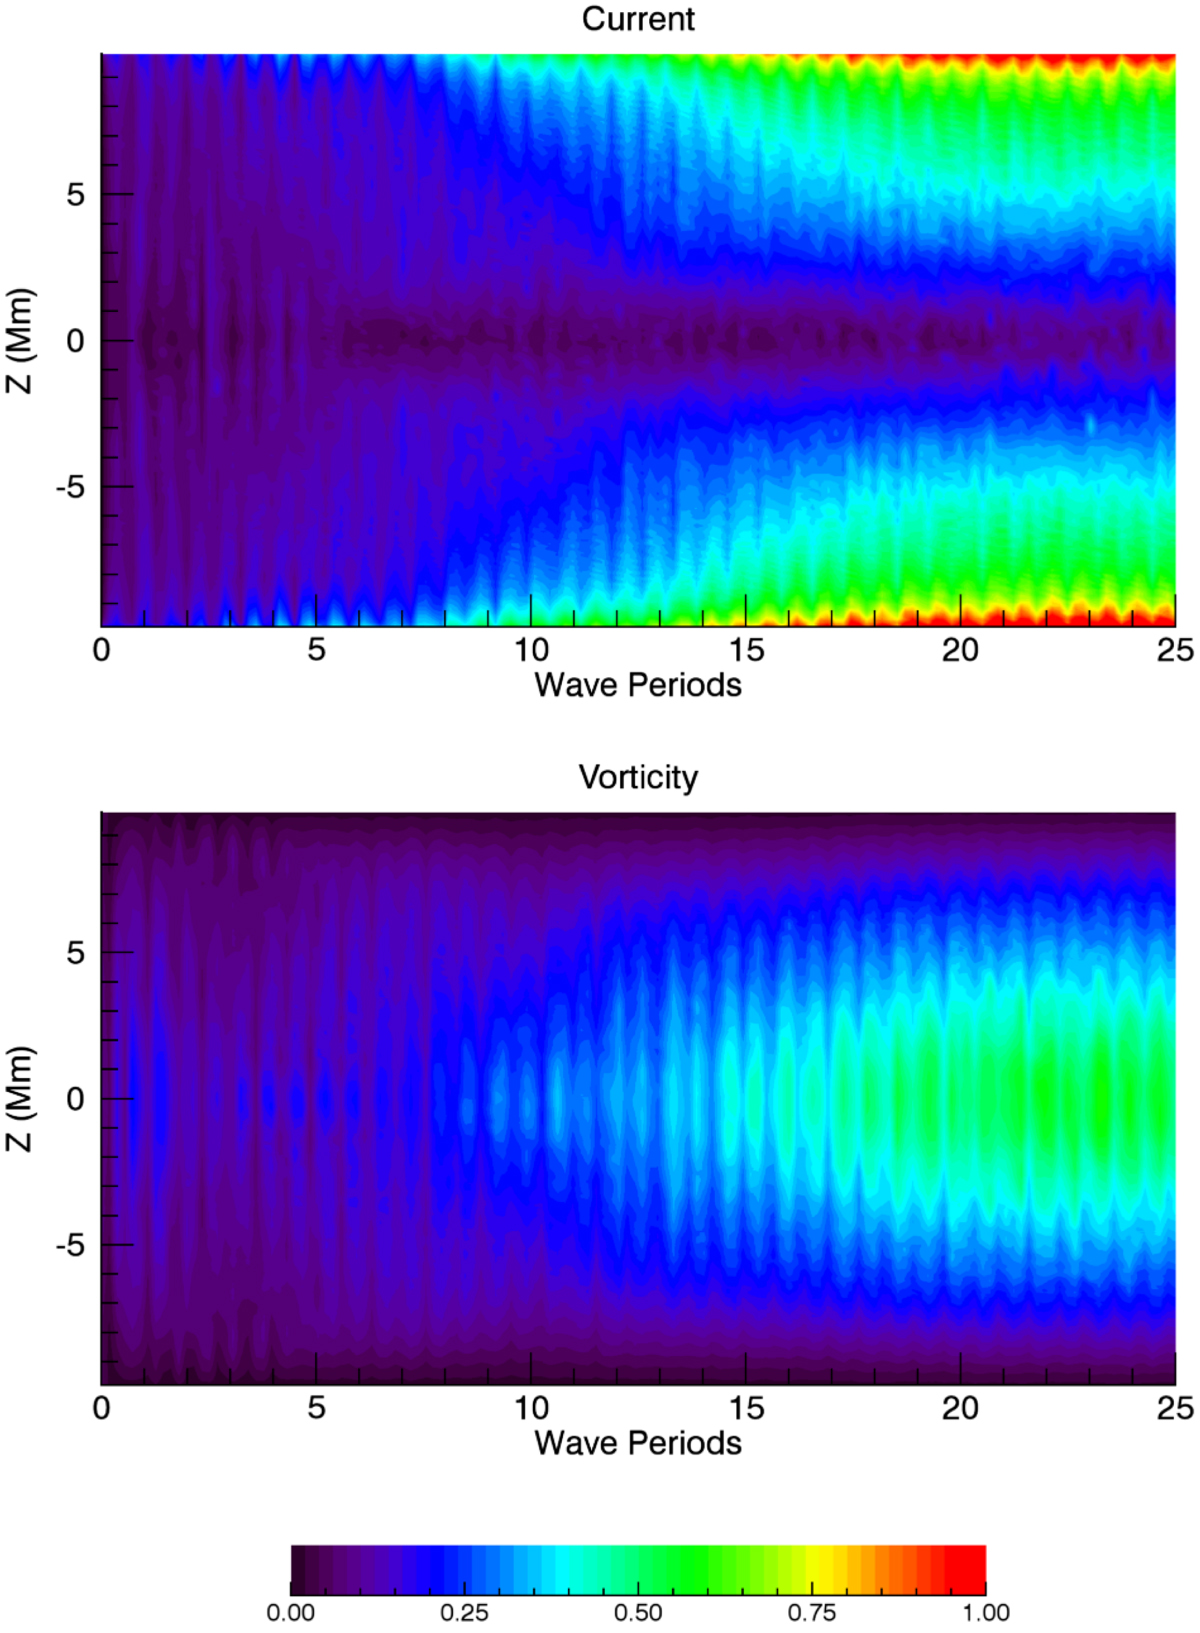
Total current (upper) and vorticity (lower) across loop cross-section as a function of distance along the loop and time. In both cases, we have normalised by the maximum value of the total current.
Current usage metrics show cumulative count of Article Views (full-text article views including HTML views, PDF and ePub downloads, according to the available data) and Abstracts Views on Vision4Press platform.
Data correspond to usage on the plateform after 2015. The current usage metrics is available 48-96 hours after online publication and is updated daily on week days.
Initial download of the metrics may take a while.