Fig. 7
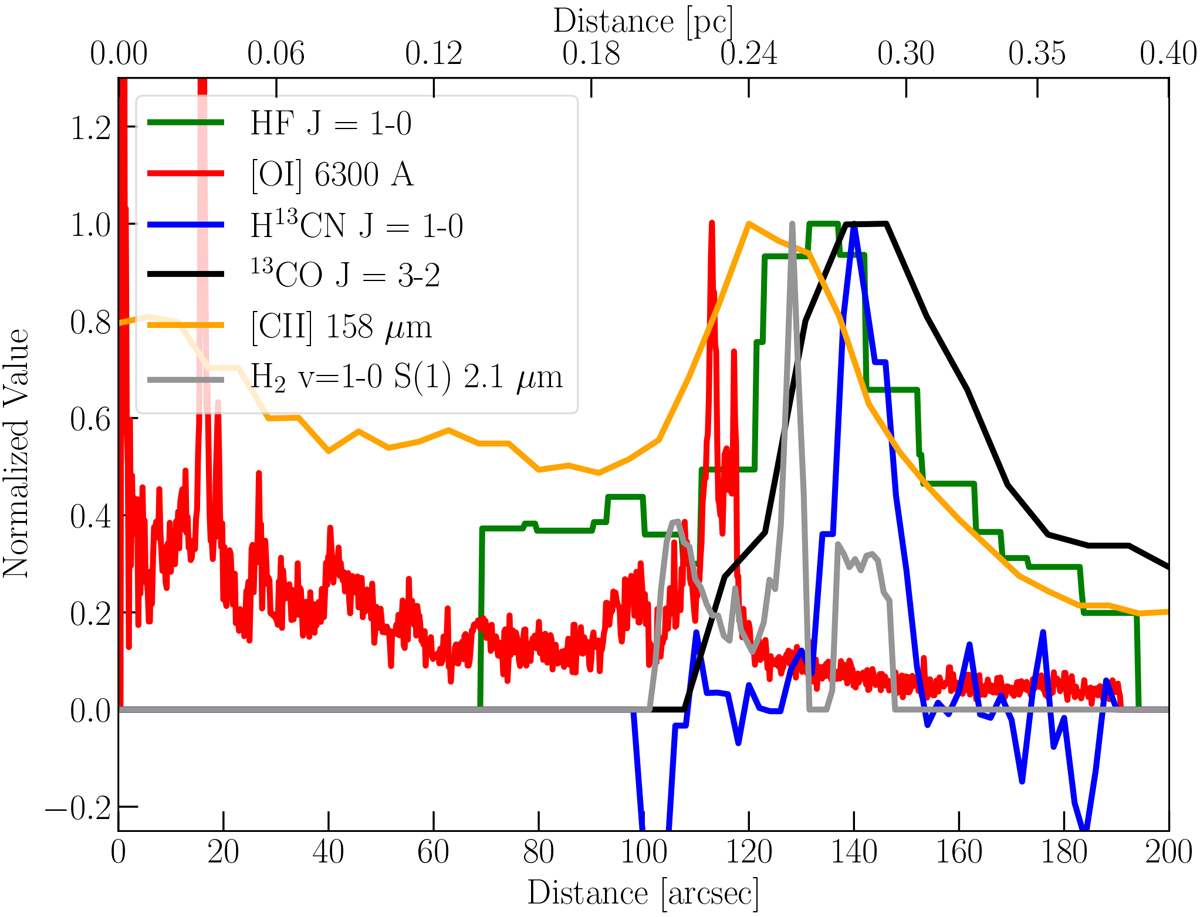
Spatial distribution of different tracers along a crosscut which was chosen over the Orion Bar where the layered structure of the Orion Bar can be seen. The plot starts from θ1 Ori C which is the main ionizing member of the Trapezium stars. The spatial resolution of HF, [O I], H13 CN, 13CO, [C II], and H2 is 18.1′′, 0.2′′, 9.2′′, 22′′, 11.4′′, respectively.
Current usage metrics show cumulative count of Article Views (full-text article views including HTML views, PDF and ePub downloads, according to the available data) and Abstracts Views on Vision4Press platform.
Data correspond to usage on the plateform after 2015. The current usage metrics is available 48-96 hours after online publication and is updated daily on week days.
Initial download of the metrics may take a while.