Free Access
Fig. 3
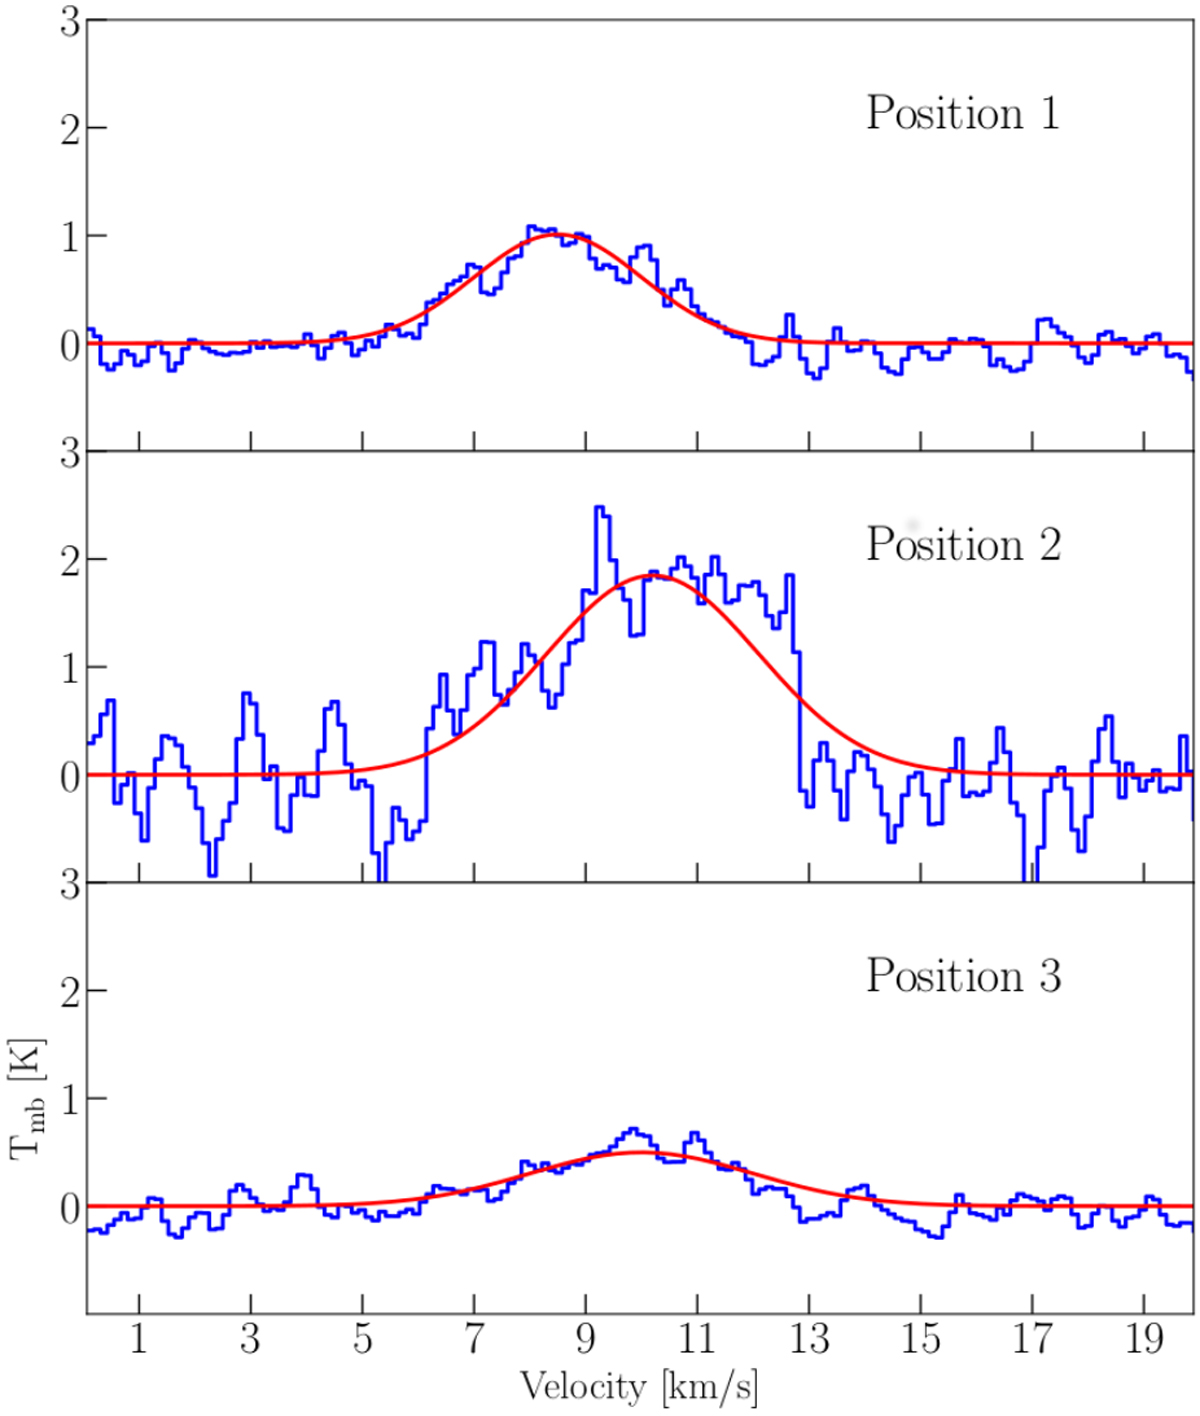
Upper panel: HF spectrum toward HII region at position 1 and Gaussian fit, which is in red. Middle panel (position 2): spectrum at HF peak, which has also been studied by van der Tak et al. (2012). The components of HF lines is given in Fig. 8. Bottom panel (position 3): spectrum observed toward the molecular cloud.
Current usage metrics show cumulative count of Article Views (full-text article views including HTML views, PDF and ePub downloads, according to the available data) and Abstracts Views on Vision4Press platform.
Data correspond to usage on the plateform after 2015. The current usage metrics is available 48-96 hours after online publication and is updated daily on week days.
Initial download of the metrics may take a while.