Fig. 2
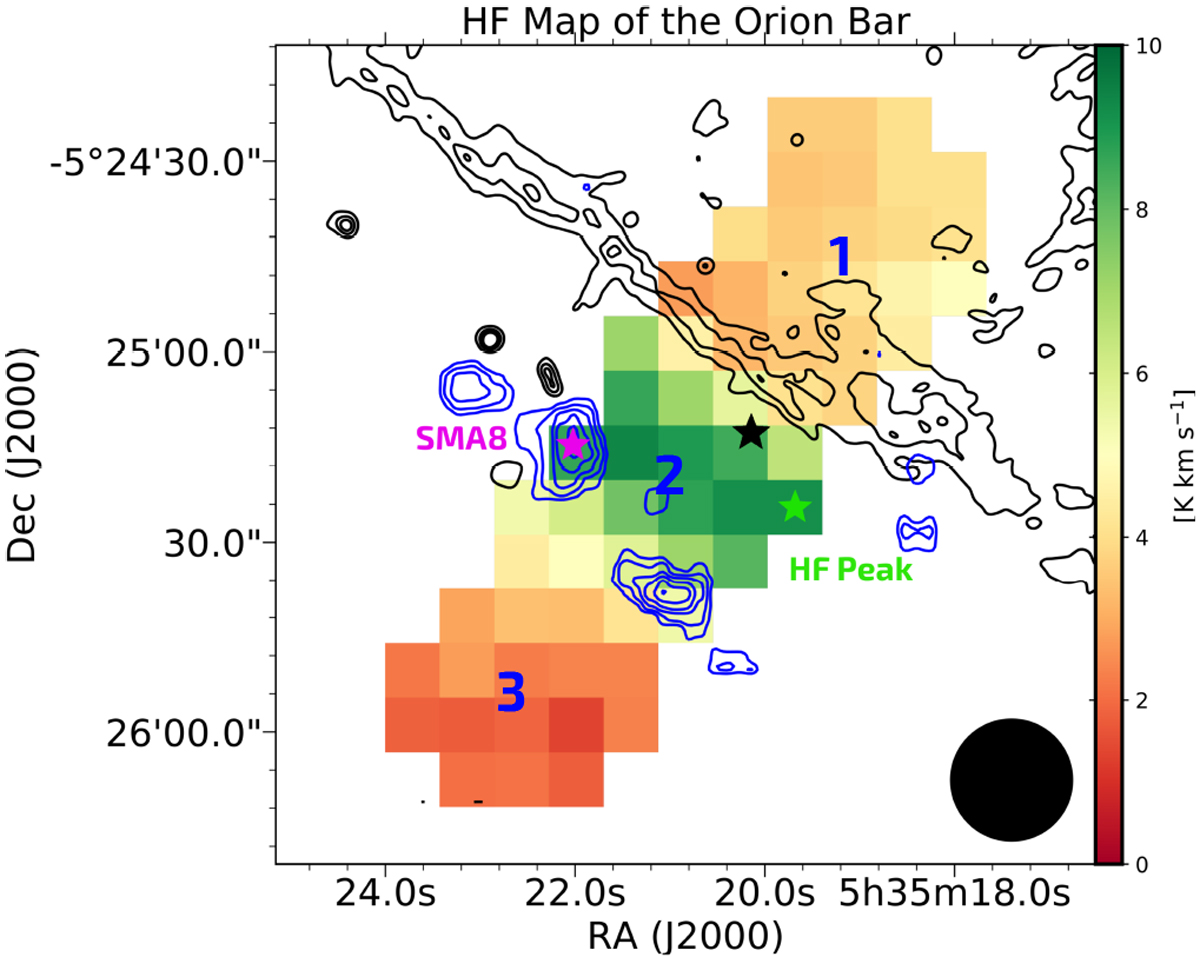
Map of integrated (between 5 and 13 km s−1) HF J = 1 → 0 intensity overlaid with [O I] 6300 Å, which traces the ionization front of the Orion Bar and is shown with black contours, and the H13 CN dense gas tracer, shown in blue contours. The positions where the three spectra in Fig. 3 were extracted are indicated by numbers 1 through 3. The black circle shows the (18.1′′) FWHM HIFI beam and the pixel size in this map is 4.5′′. SMA8 denotes a dust condensation (Qiu et al. 2018). The light green star denotes the HF peak. The black star shows the CO+ peak.
Current usage metrics show cumulative count of Article Views (full-text article views including HTML views, PDF and ePub downloads, according to the available data) and Abstracts Views on Vision4Press platform.
Data correspond to usage on the plateform after 2015. The current usage metrics is available 48-96 hours after online publication and is updated daily on week days.
Initial download of the metrics may take a while.