Fig. 11
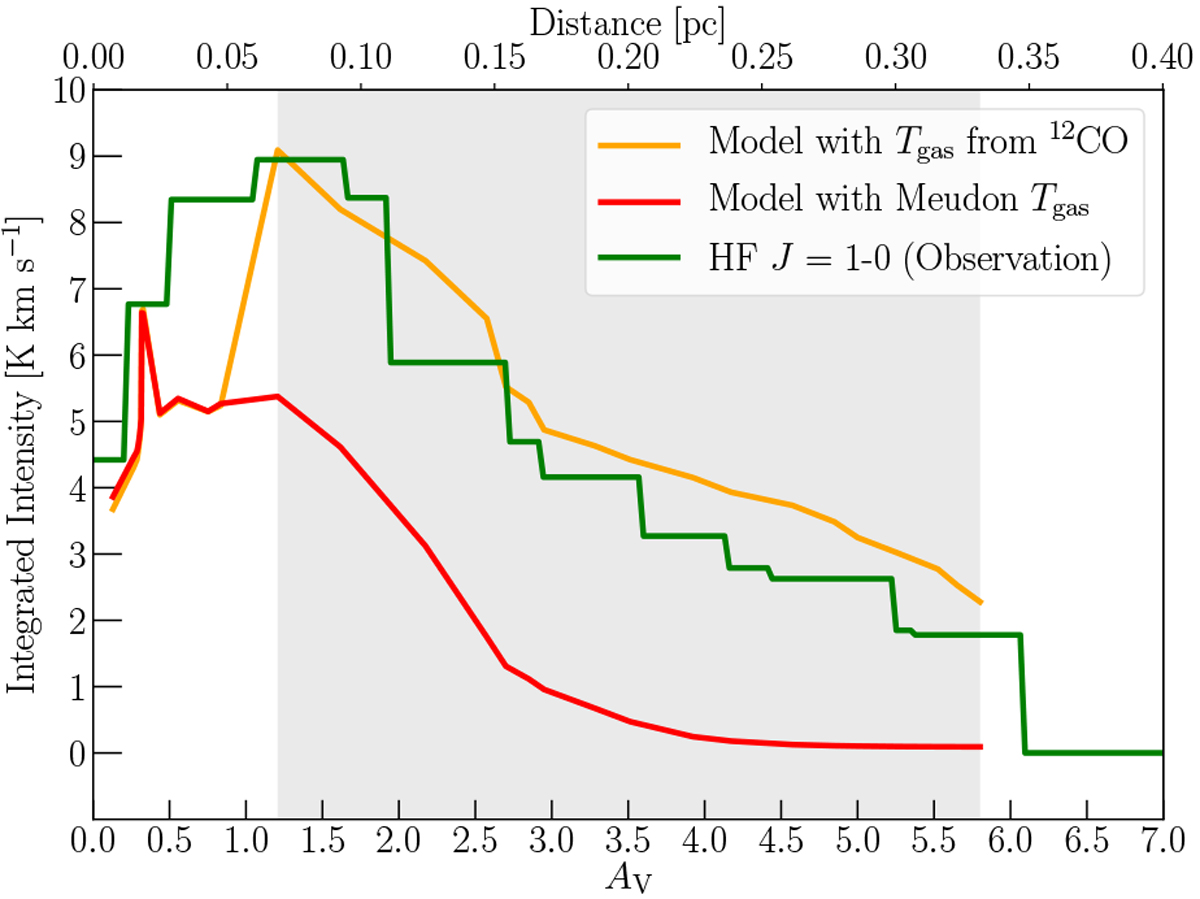
Comparison of RADEX models with the HF observation. While green curve shows the HF observation, orange curve show the RADEX model we created with the temperature taken from Tauber et al. (1994). Red curve shows a second RADEX model where we use the temperature calculated by Meudon code. We run these models with the same input parameters except for the temperature to figure out the relative importance of the temperature. The temperature is warmer thanthe model predict in the deep cloud. Since we are unable extract the temperature profile near the surface from 12CO observations because CO is not formed, we have only focused on the decreasing profile of HF between Av = 1.2−5.8, that is, gray-shaded region, for this comparison. The rest does not reflect proper calculation. See the text for detailed discussion.
Current usage metrics show cumulative count of Article Views (full-text article views including HTML views, PDF and ePub downloads, according to the available data) and Abstracts Views on Vision4Press platform.
Data correspond to usage on the plateform after 2015. The current usage metrics is available 48-96 hours after online publication and is updated daily on week days.
Initial download of the metrics may take a while.