Fig. 1
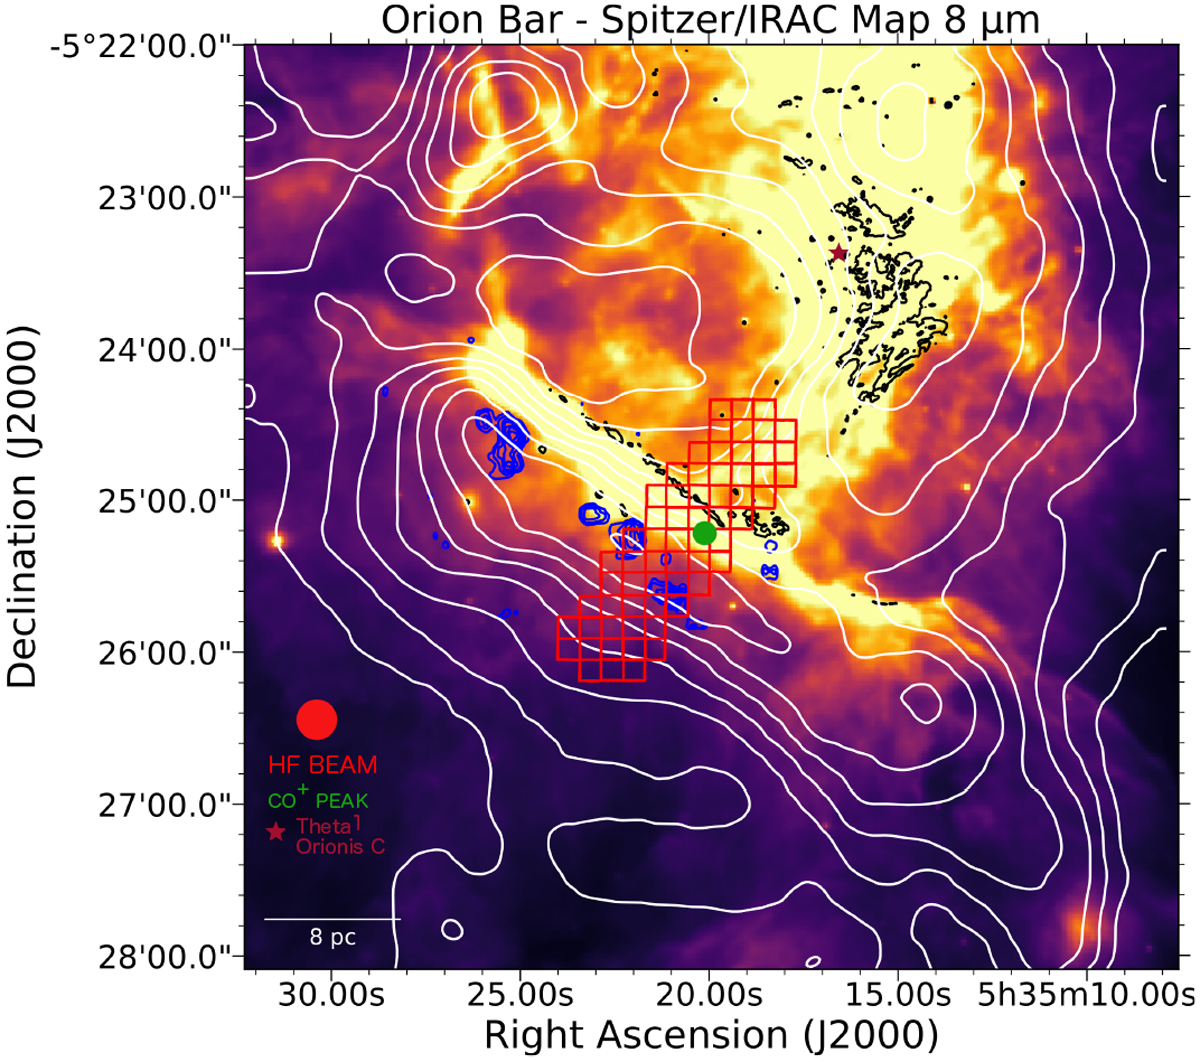
Spitzer 8 μm map of Orion Bar. Blue contours show H13CN J = 1 → 0 (Lis & Schilke 2003), which traces dense gas clumps, white contours are 12CO J = 1 → 0 (Tauber et al. 1994), which traces molecular gas, and black contours are [O I] 6300 Å (Weilbacher et al. 2015), which traces the ionization front. The red squares show the HF strip map perpendicular to the Orion Bar.
Current usage metrics show cumulative count of Article Views (full-text article views including HTML views, PDF and ePub downloads, according to the available data) and Abstracts Views on Vision4Press platform.
Data correspond to usage on the plateform after 2015. The current usage metrics is available 48-96 hours after online publication and is updated daily on week days.
Initial download of the metrics may take a while.