Fig. 4
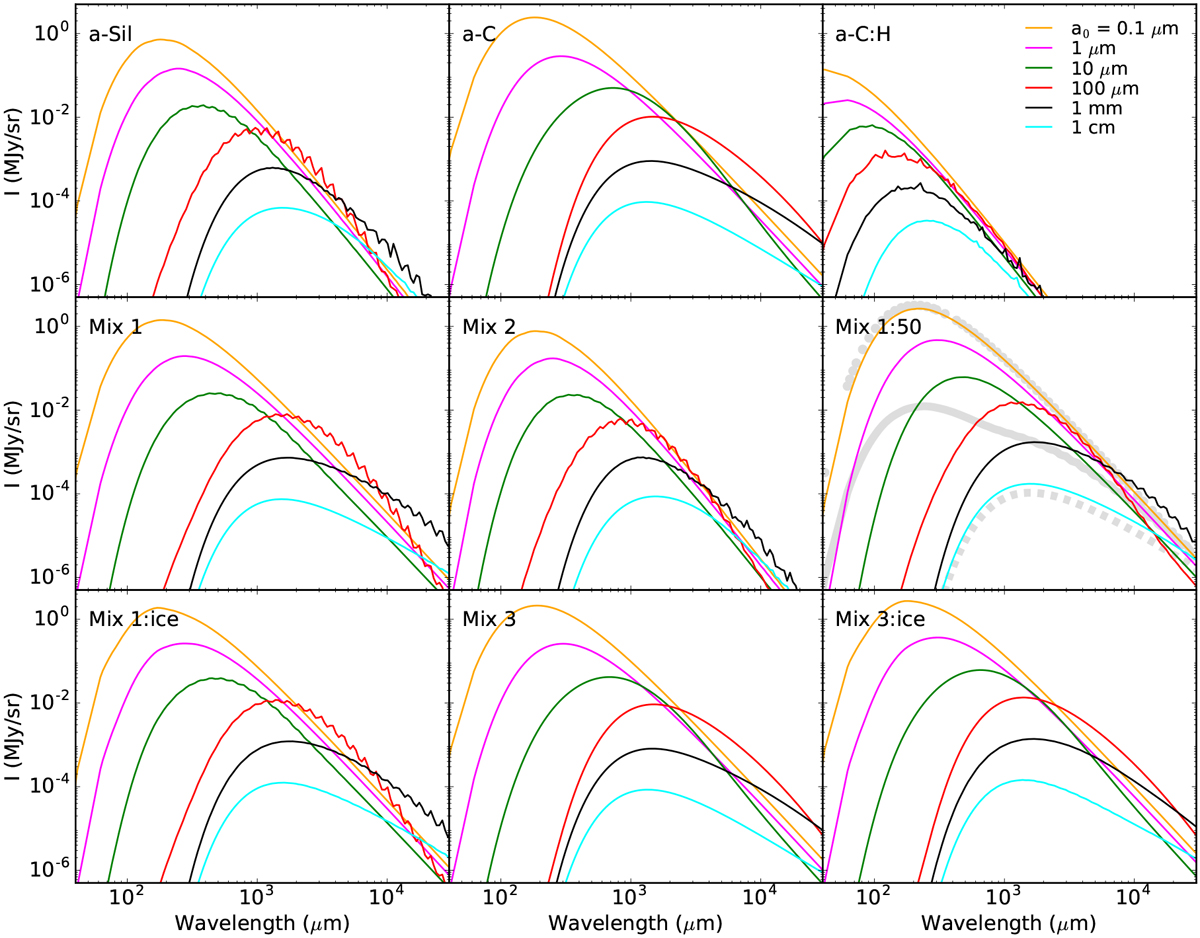
Spectral energy distributions for the dust compositions described in Sect. 2.1 and Table 1. The SEDs were obtained considering an optically thin medium with a column density NH = 1020 H cm−2 illuminated by the standard ISRF (see Sect. 2.3 for details). The orange lines show the case where the centroid of the log-normal size distribution is a0 = 0.1 μm, the pink lines where a0 = 1 μm, the green lines where a0 = 10 μm, the red lines where a0 = 100 μm, the black lines where a0 = 1 mm, and the cyanlines where a0 = 1 cm. The thick grey curves on the Mix 1:50 plot present the case of power-law size distributions with amin = 0.01 μm and where the dotted line shows the case of p =−3.5 and amax = 1 μm, the solid lineof p =−3.5 and amax = 10 cm, and the dashed line of p = −2 and amax = 10 cm.
Current usage metrics show cumulative count of Article Views (full-text article views including HTML views, PDF and ePub downloads, according to the available data) and Abstracts Views on Vision4Press platform.
Data correspond to usage on the plateform after 2015. The current usage metrics is available 48-96 hours after online publication and is updated daily on week days.
Initial download of the metrics may take a while.