Fig. 5
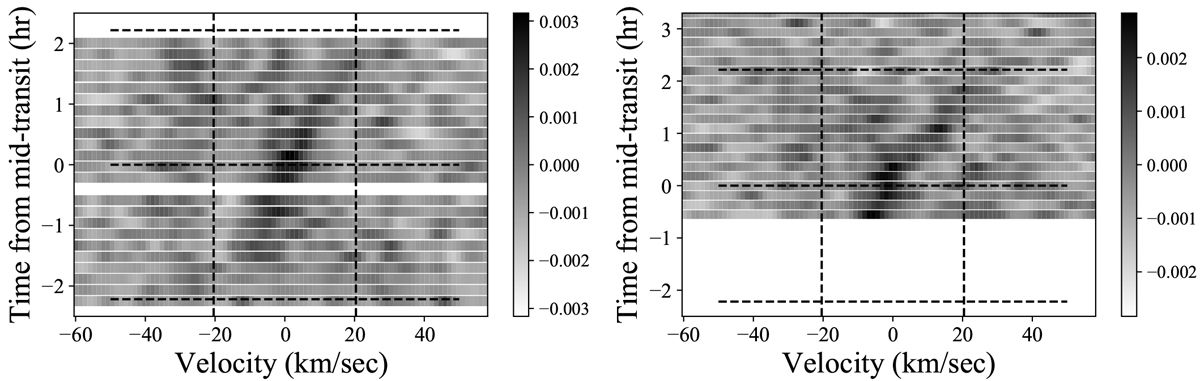
Spectroscopic transits of MASCARA-3 observed on the night of May 29, 2018 (left), and November 28, 2018 (right). Both plots show the observed CCFs, with the subtraction of the mean out-of-transit CCF obtained from the second night. Before subtraction, these CCFs were scaled and offset from their model counterpart in intensity (all CCFs) and scaled in velocity space (in-transit CCFs) in order to account for uneven normalization due to differences in flux levels and PSF changes. The vertical dashed lines mark the best-fit value of the v sin i⋆ from the BF analysis, and the horizontal dashed lines mark the best-fit value for the transit ingress, mid-transit time, and egress.
Current usage metrics show cumulative count of Article Views (full-text article views including HTML views, PDF and ePub downloads, according to the available data) and Abstracts Views on Vision4Press platform.
Data correspond to usage on the plateform after 2015. The current usage metrics is available 48-96 hours after online publication and is updated daily on week days.
Initial download of the metrics may take a while.