Free Access
Fig. 4
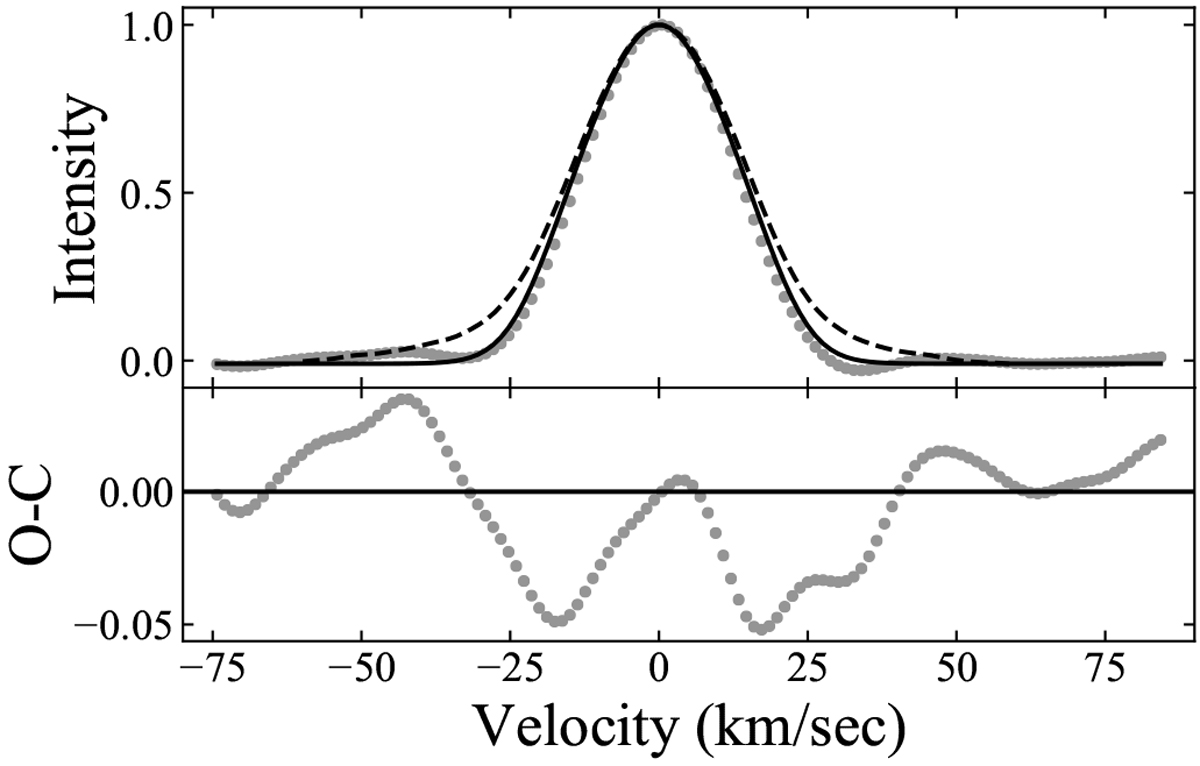
Mean out-of-transit BF (grey) with the best-fitting stellar absorption line model (black). For comparison the dashed line shows the mean out-of-transit CCF, which erroneously leads to an enlarged line width because of its wings, which we assume are caused by an imperfect normalization of the low S/N spectra (see Sect. 4.2).
Current usage metrics show cumulative count of Article Views (full-text article views including HTML views, PDF and ePub downloads, according to the available data) and Abstracts Views on Vision4Press platform.
Data correspond to usage on the plateform after 2015. The current usage metrics is available 48-96 hours after online publication and is updated daily on week days.
Initial download of the metrics may take a while.