Fig. 3
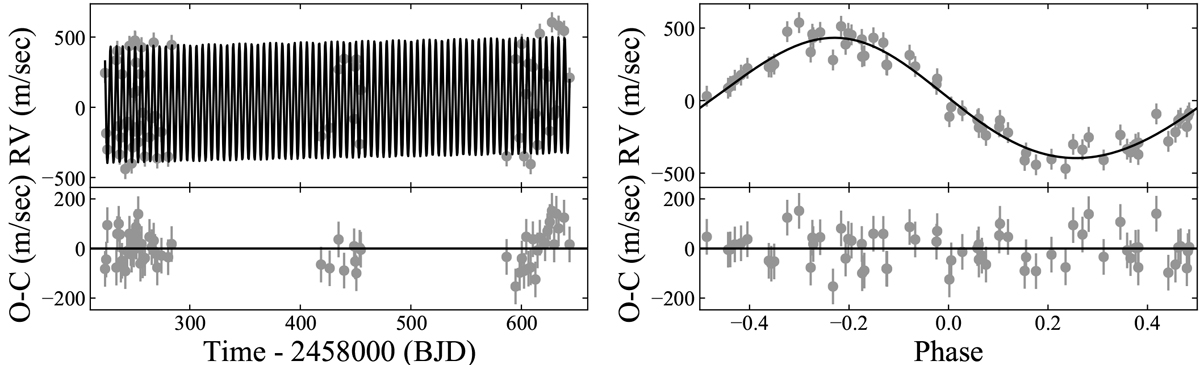
Radial velocity data from the SONG telescope (gray) with the best-fit Keplerian model (black) from the joint photometricand RV analysis. The data are plotted as a function of time (left) and phase-folded (right) to highlight that we allowed for the possibility of a linear trend in the RV. In the panel on the right side the best-fitting RV trend was removed from the data and model. The best-fit parameters are displayed in Table 4. The bottom plot shows the residuals.
Current usage metrics show cumulative count of Article Views (full-text article views including HTML views, PDF and ePub downloads, according to the available data) and Abstracts Views on Vision4Press platform.
Data correspond to usage on the plateform after 2015. The current usage metrics is available 48-96 hours after online publication and is updated daily on week days.
Initial download of the metrics may take a while.