Fig. 3.
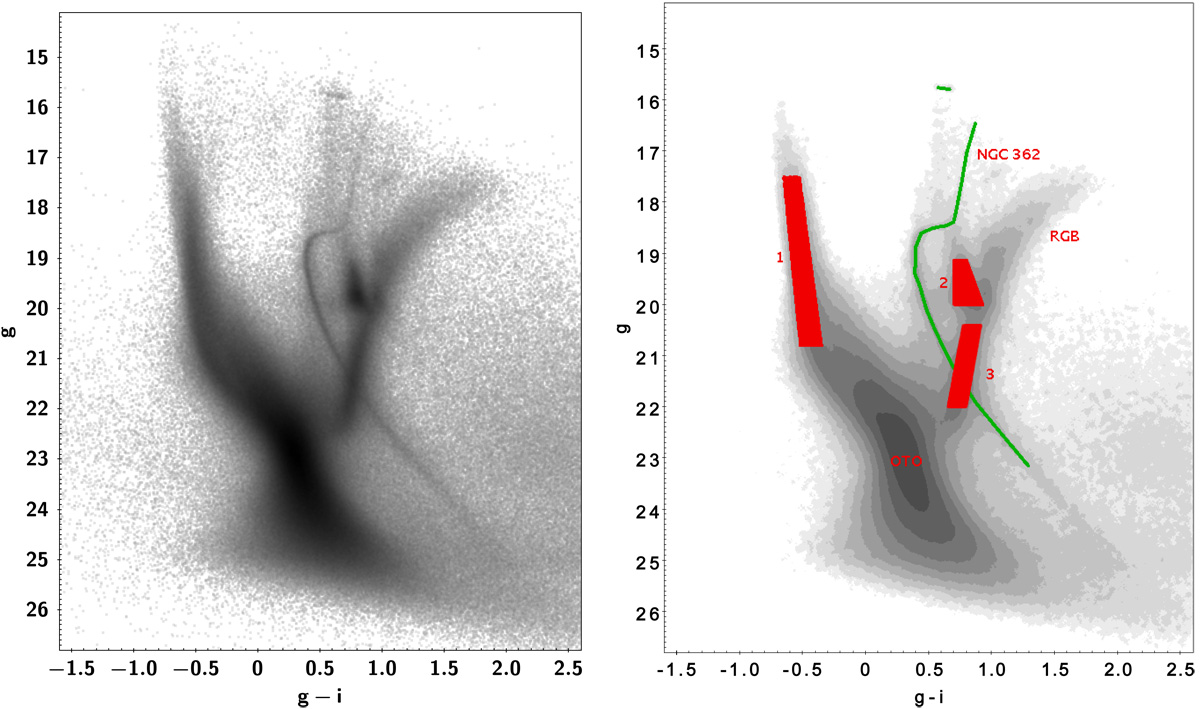
Left panel: color–magnitude diagram of ∼2.5 million stars in SMASH Fields 9, 14, and 15 in the outskirts of the SMC. Besides the strong features due to the SMC populations, the narrow main sequence, sub-giant branch, and red giant branch of the globular cluster NGC 362 are also visible in this diagram. Right panel: density countours of the right panel highlighting the densest parts of the CMD, including the old turn-off (OTO) and the RGB. The red boxes isolate other features of the SMC stellar population: (1) upper main sequence, (2) red clump, and (3) lower part of the red giant branch.
Current usage metrics show cumulative count of Article Views (full-text article views including HTML views, PDF and ePub downloads, according to the available data) and Abstracts Views on Vision4Press platform.
Data correspond to usage on the plateform after 2015. The current usage metrics is available 48-96 hours after online publication and is updated daily on week days.
Initial download of the metrics may take a while.