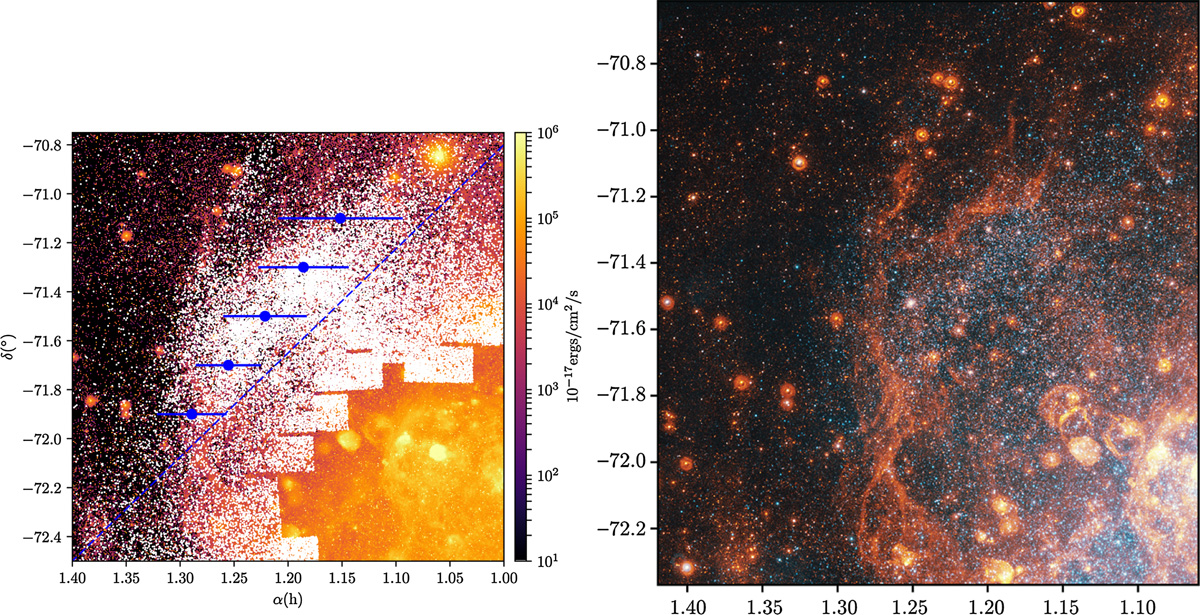
Fig. 14.

Left panel: MCELS Hα density map (red, following the color-bar density in the right side) compared to the young star density map plotted in Fig. 4. Blue dots are the mean stellar position (and its dispersion as error bars) for stars located on the east of blue dashed line (on the right panel), grouped in 5 bins of declination (−71 > δ − 72). Right: MCELS Hα image zoomed in the region of the shell over-plotted to the GALEX image (see Fig. 5). It shows that a Hα filament clearly overlaps the position of the spiral-arm-like feature (labeled b in Fig. 4).
Current usage metrics show cumulative count of Article Views (full-text article views including HTML views, PDF and ePub downloads, according to the available data) and Abstracts Views on Vision4Press platform.
Data correspond to usage on the plateform after 2015. The current usage metrics is available 48-96 hours after online publication and is updated daily on week days.
Initial download of the metrics may take a while.


