Fig. 13.
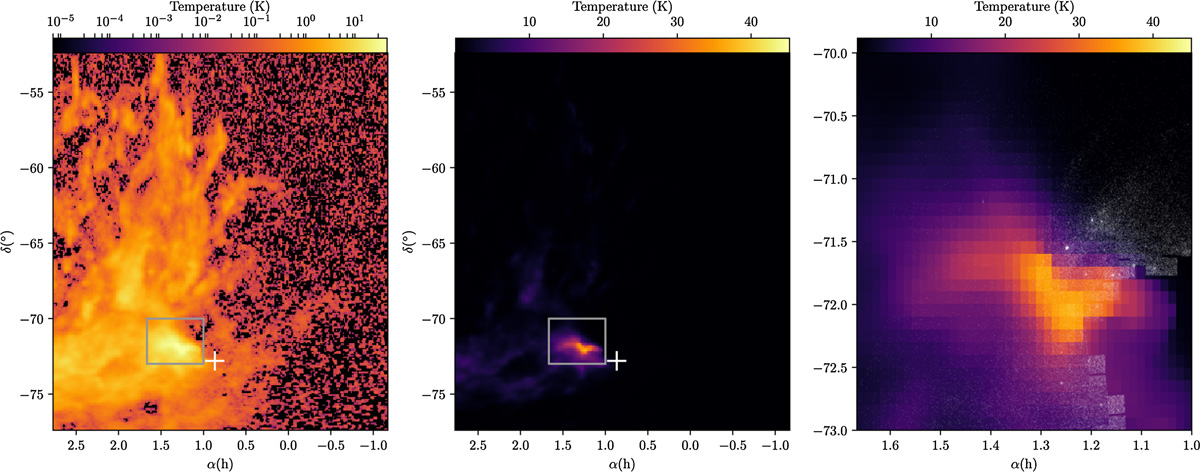
Left panel: GASS H I emission for the velocity channel v = 198 km s−1, in a log scale. The center of the SMC is marked by a white plus sign. The grey rectangle in this and the following panel is zoomed in the right panel. Central panel: same region as the previous panel, but showing in a linear scale the mean temperature for the mean ±1σ distribution in the velocity channel. A clear “Z” shape is seen with a gradient in temperature toward the center of the SMC. Right panel: enlarged region (grey rectangles in the previous panels) showing the distribution of H I in a linear scale over-plotted to the young main sequence stars as white dots (box 1 in Fig. 3).
Current usage metrics show cumulative count of Article Views (full-text article views including HTML views, PDF and ePub downloads, according to the available data) and Abstracts Views on Vision4Press platform.
Data correspond to usage on the plateform after 2015. The current usage metrics is available 48-96 hours after online publication and is updated daily on week days.
Initial download of the metrics may take a while.