Fig. 12.
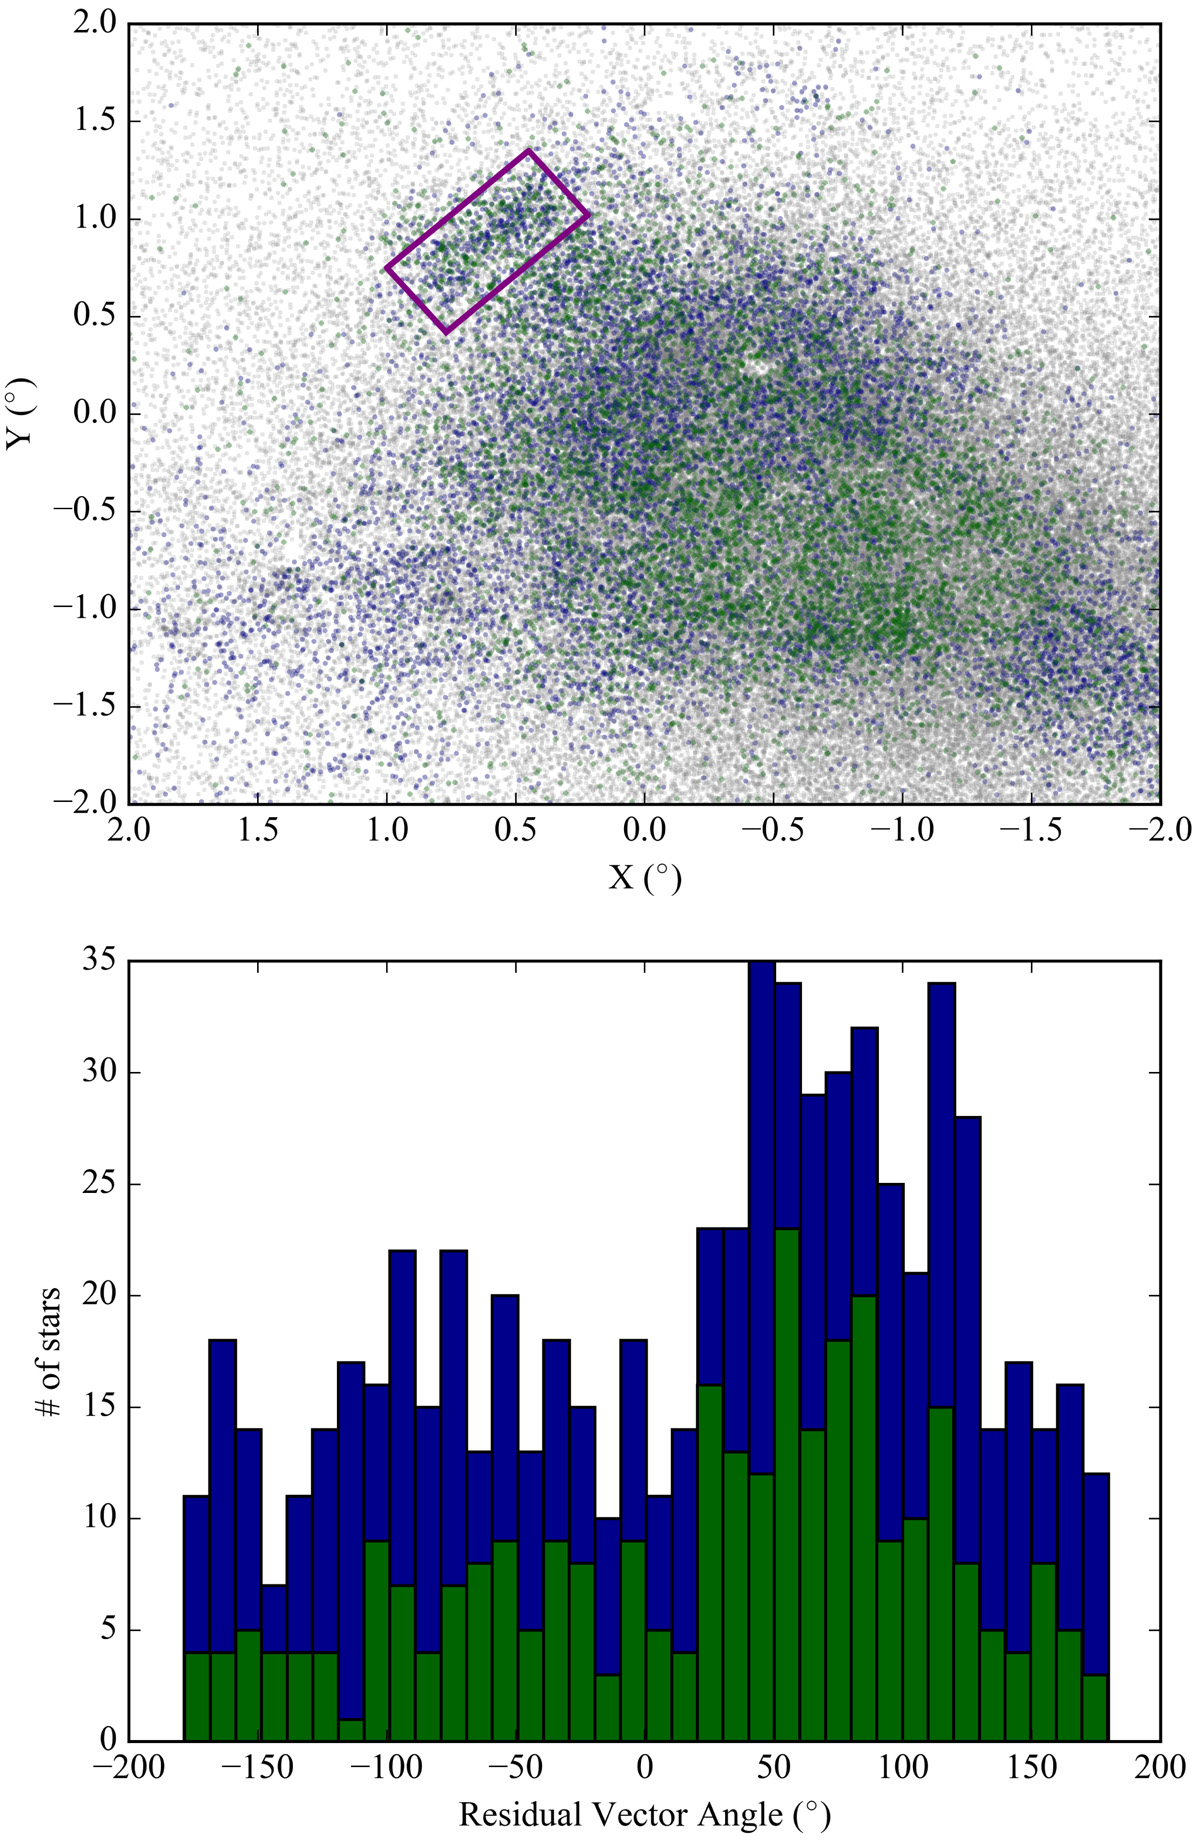
Top panel: spatial plot of our selected Gaia sample (marked in grey), discussed in Sect. 3.5, with the main sequence (MS, blue) and red supergiant (RSG, green) sequences shown in Fig. 11 overplotted. The shell feature can be seen toward the center-left area of the plot in addition to significant substructure in the two sequences spread throughout the SMC. This feature has been marked with a purple box, and all stars that fall within the box are examined below in addition to being overplotted in the CMD for the SMC (seen in the bottom panel of Fig. 11). Bottom panel: combined histogram of the residual proper motion vector angles of the MS and RSG populations after removing the systemic motion of the SMC and correcting for viewing perspective. Only stars that fall within the marked box in the top of Fig. 12 are displayed, indicated by the same colors as above. The angle measurement is defined so that a residual vector pointing vertically in the spatial plot corresponds to an angle of 0°, and the angle increases in a counter- clockwise direction. A clear preference for a mean residual vector angle of ∼70 − 80° can be seen, which roughly points radially outwards from the center of the SMC.
Current usage metrics show cumulative count of Article Views (full-text article views including HTML views, PDF and ePub downloads, according to the available data) and Abstracts Views on Vision4Press platform.
Data correspond to usage on the plateform after 2015. The current usage metrics is available 48-96 hours after online publication and is updated daily on week days.
Initial download of the metrics may take a while.