Fig. 11.
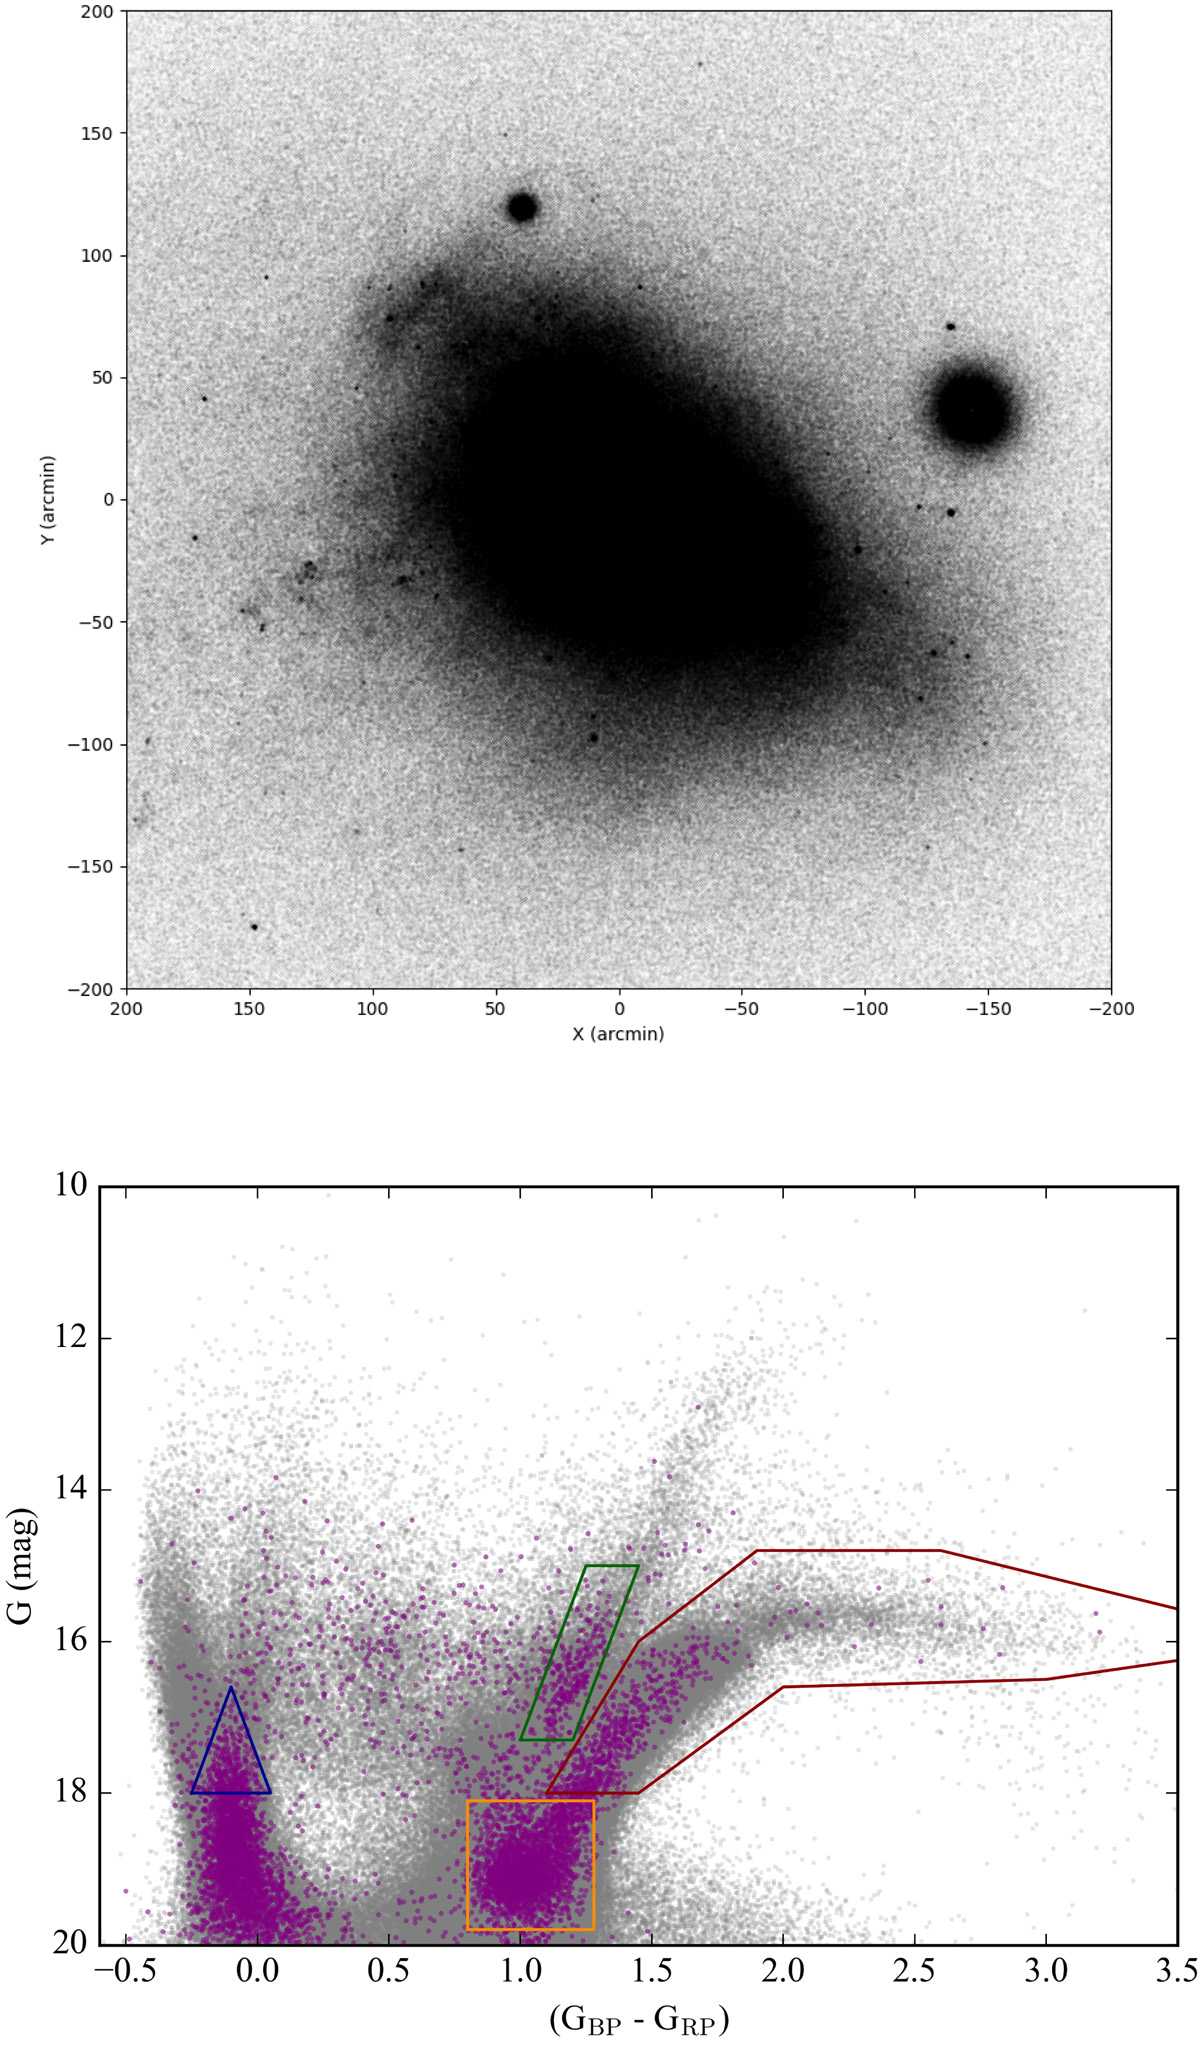
Top panel: star map made with all the Gaia DR2 (Gaia Collaboration et al. 2018a) sources with VISIBILITY_PERIODS_USED ≥5 and PHOT_BP_RP_EXCESS_FACTOR < 1.5 in a 400 arcmin × 400 arcmin box centered in the SMC. For orientation reference, the LMC is located down and to the left of the plot. The previously described shell and new features showed in Fig. 4 (right panel) are clearly visible in the Gaia data. Bottom panel: CMD of an astrometrically selected sample of Gaia sources with G < 18 and |μ|< 5 mas yr−1 (marked in gray) with all sources selected within the shell region (the exact area selected can be seen in the top panel of Fig. 12) over-plotted in purple. The masks for selecting different CMD features are also over-plotted: main sequence (MS, blue), red supergiants (RSG, green), red clump (orange) and red giant branch (red).
Current usage metrics show cumulative count of Article Views (full-text article views including HTML views, PDF and ePub downloads, according to the available data) and Abstracts Views on Vision4Press platform.
Data correspond to usage on the plateform after 2015. The current usage metrics is available 48-96 hours after online publication and is updated daily on week days.
Initial download of the metrics may take a while.