Fig. B.1
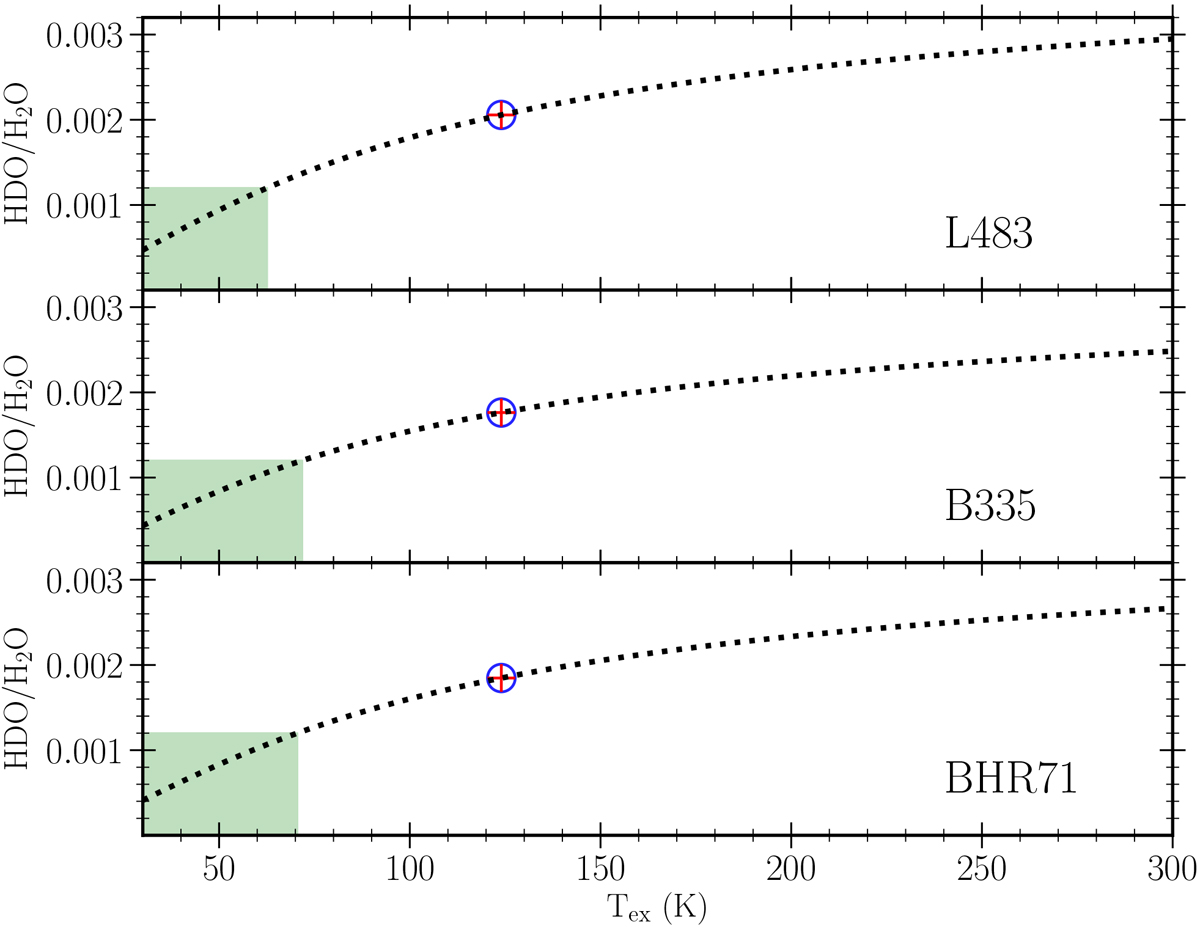
HDO/H2O ratio for the three sources assuming excitation temperatures in the range 30–300 K and optically thin LTE emission. The green shaded area show the upper limit for the HDO/H2O ratio for the clustered protostars presented in Persson et al. (2014). The blue circle marks the value at the assumed excitation temperature of 124 K value.
Current usage metrics show cumulative count of Article Views (full-text article views including HTML views, PDF and ePub downloads, according to the available data) and Abstracts Views on Vision4Press platform.
Data correspond to usage on the plateform after 2015. The current usage metrics is available 48-96 hours after online publication and is updated daily on week days.
Initial download of the metrics may take a while.